mr. smith measured the heights of some students in his math class. students heights (in.) 56 61 55 63 66 63…
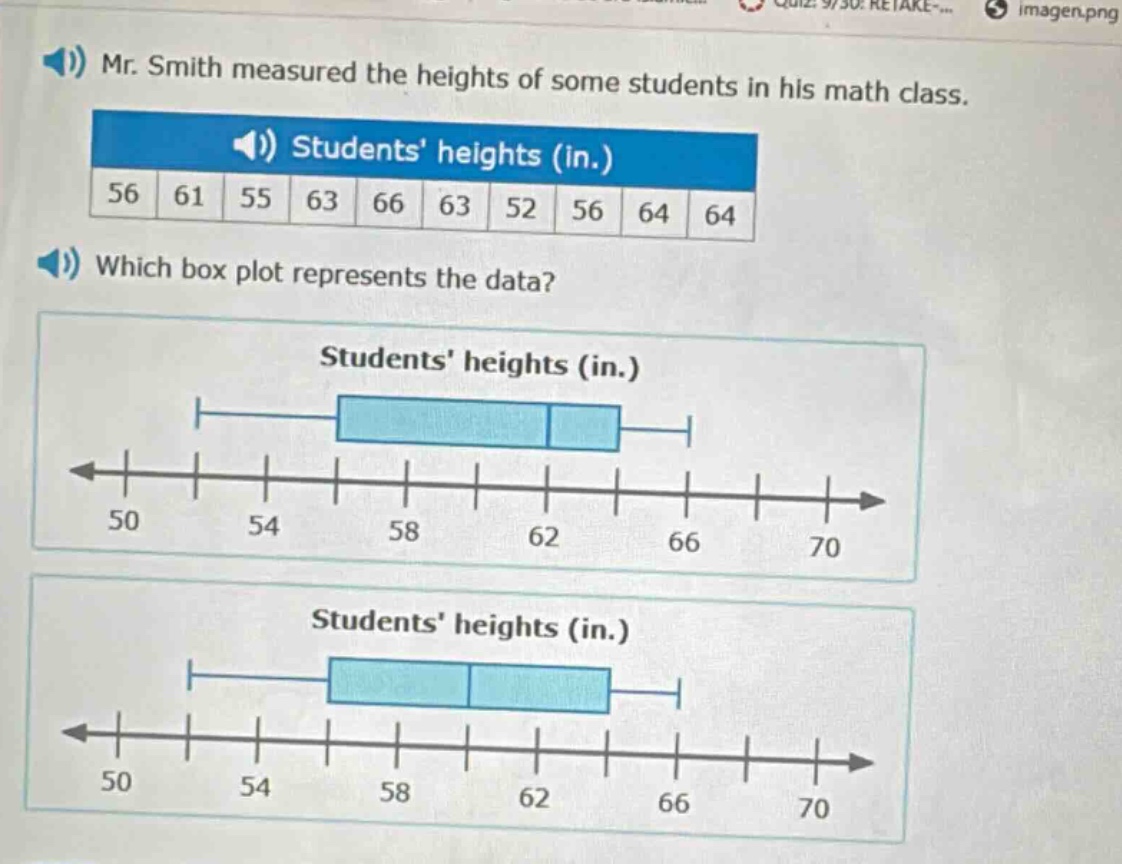
mr. smith measured the heights of some students in his math class. students heights (in.) 56 61 55 63 66 63 52 56 64 64 which box plot represents the data? students heights (in.) students heights (in.)
Answer
Explanation:
Step1: Ordenar los datos
52, 55, 56, 56, 61, 63, 63, 64, 64, 66
Step2: Encontrar el mínimo
El mínimo es 52.
Step3: Encontrar el primer cuartil ($Q_1$)
Como hay 10 datos, la posición de $Q_1$ es $\frac{10 + 1}{4}=2.75$. Entonces, $Q_1 = 56$.
Step4: Encontrar la mediana ($Q_2$)
Como hay 10 datos, la mediana es el promedio de los 5º y 6º datos ordenados. $(61 + 63)/2=62$.
Step5: Encontrar el tercer cuartil ($Q_3$)
La posición de $Q_3$ es $3\times\frac{10 + 1}{4}=8.25$. Entonces, $Q_3 = 64$.
Step6: Encontrar el máximo
El máximo es 66.
Answer:
Para determinar el box - plot correcto, se deben comparar los valores de mínimo (52), $Q_1$ (56), mediana (62), $Q_3$ (64) y máximo (66) con los valores representados en los box - plots dados. Sin conocer las opciones detalladas de los box - plots, pero con estos valores se pueden hacer las comparaciones necesarias. Si el primer box - plot tiene un extremo izquierdo en 52, el primer segmento del box hasta 56, la línea en el box en 62, el segundo segmento del box hasta 64 y un extremo derecho en 66, entonces ese es el box - plot correcto.