mrs. blair believes there is a relationship between the number of minutes students study and their test…
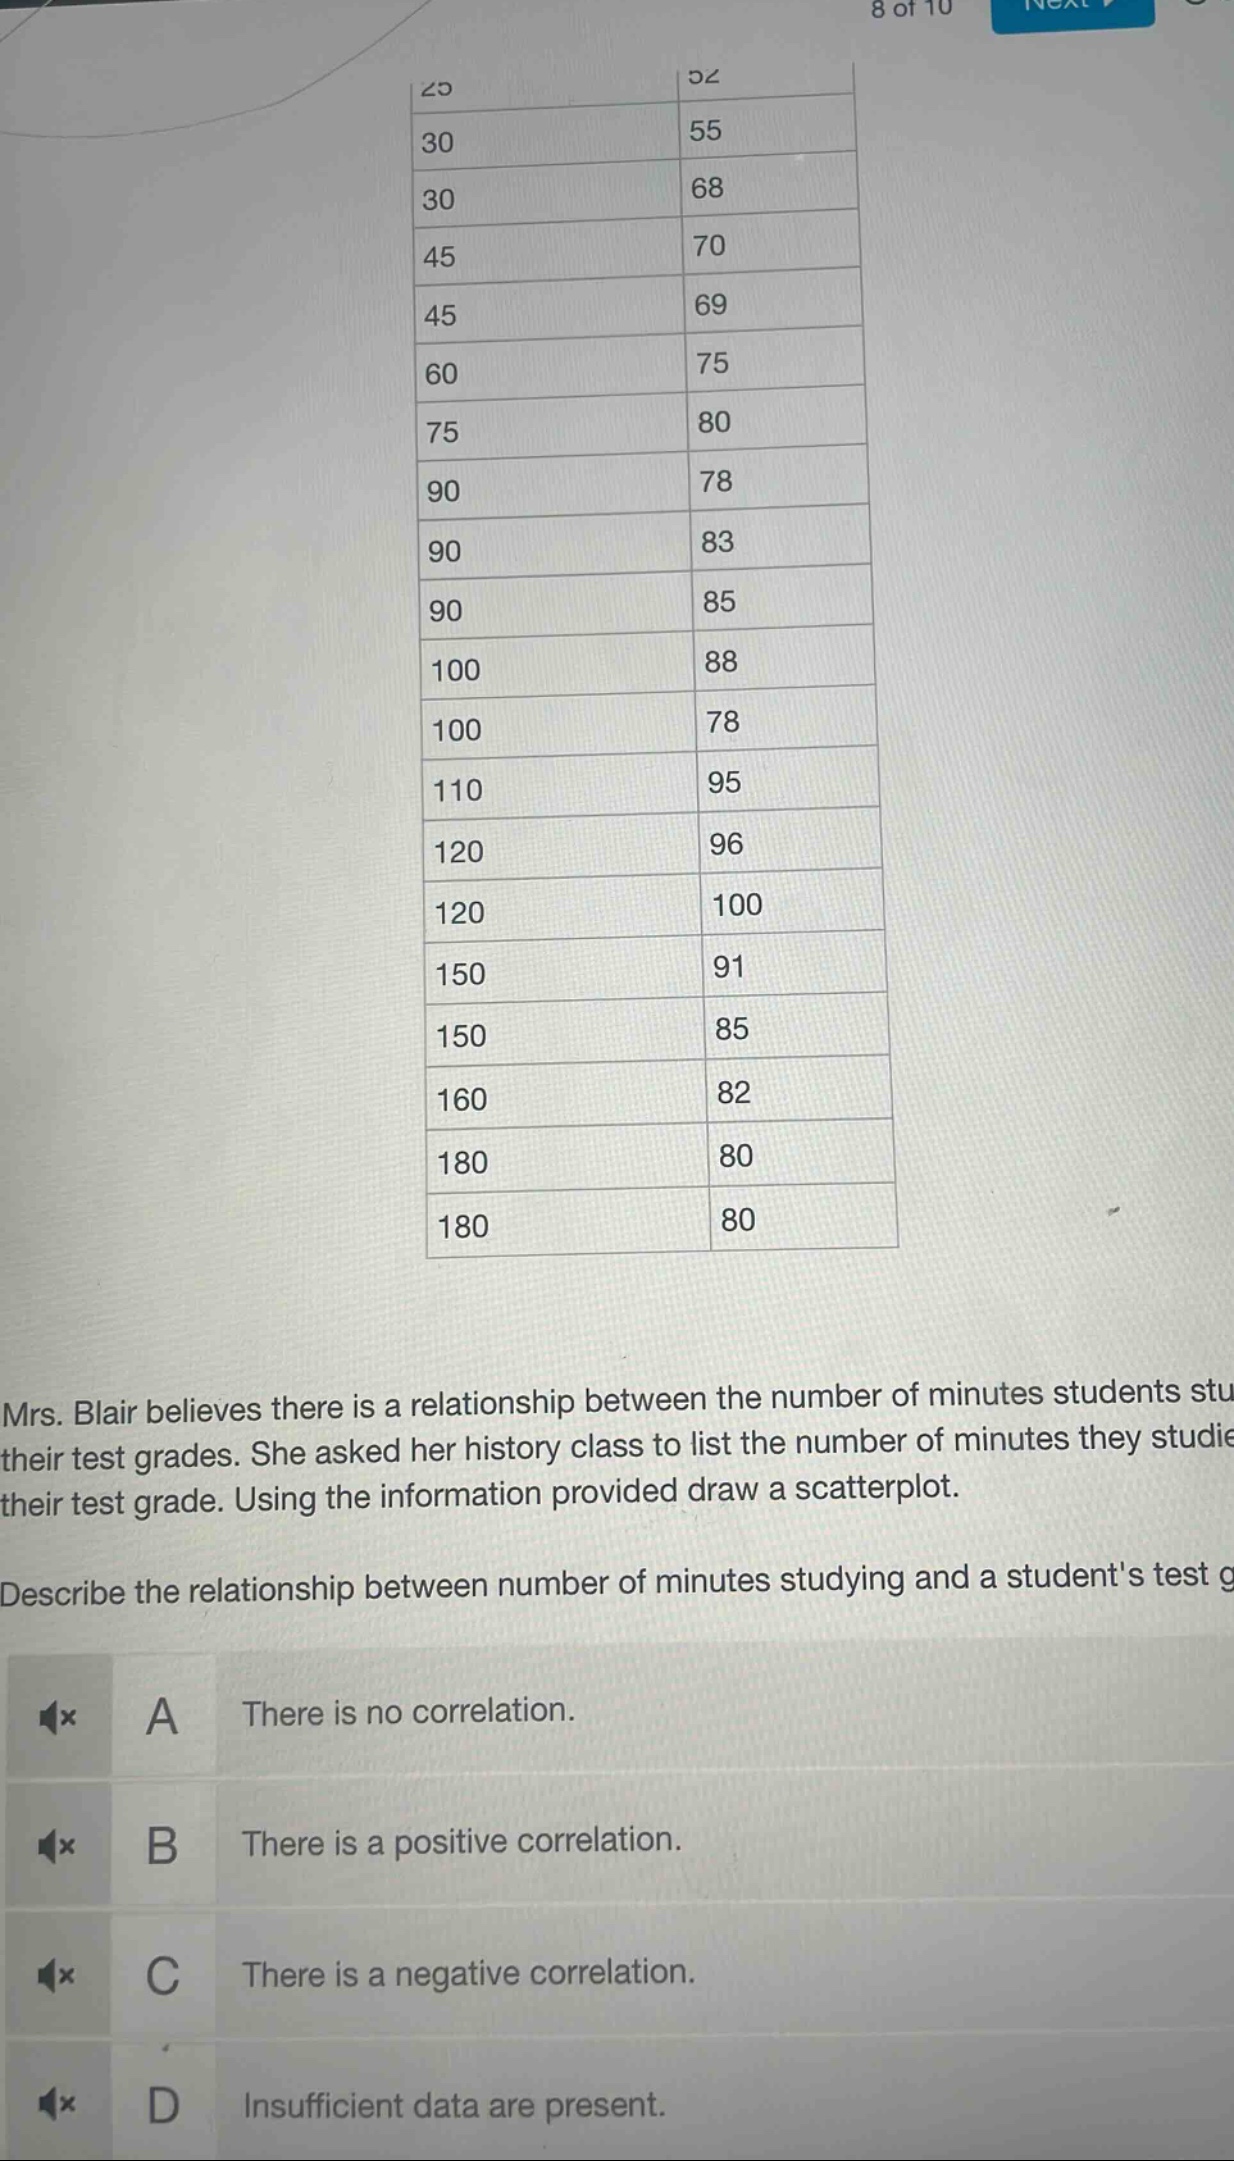
mrs. blair believes there is a relationship between the number of minutes students study and their test grades. she asked her history class to list the number of minutes they studied and their test grade. using the information provided draw a scatterplot. describe the relationship between number of minutes studying and a students test grade. a there is no correlation. b there is a positive correlation. c there is a negative correlation. d insufficient data are present.
Answer
Explanation:
Step1: Observe data trend
As the number of minutes studying (left - hand column) generally increases, the test grades (right - hand column) also tend to increase. For example, when minutes increase from 30 to 45, grades increase from around 55 - 68 to 69 - 70.
Step2: Determine correlation type
Positive correlation means that as one variable (minutes studying) increases, the other variable (test grade) also increases. Since this is the case here, we can conclude the type of correlation.
Answer:
B. There is a positive correlation.