mrs. dillon is planning a movie party to celebrate the end of the school year. she asked her 20 homeroom…
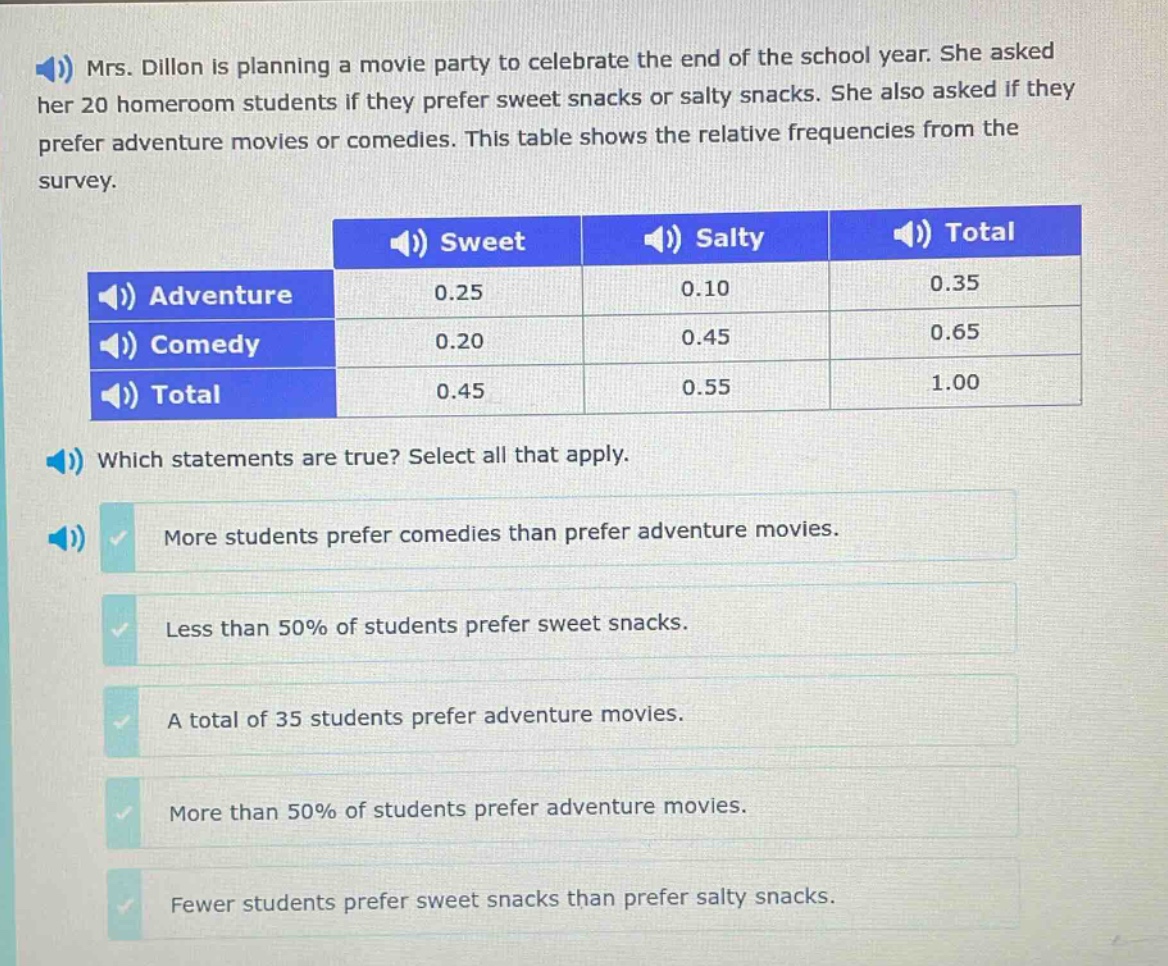
mrs. dillon is planning a movie party to celebrate the end of the school year. she asked her 20 homeroom students if they prefer sweet snacks or salty snacks. she also asked if they prefer adventure movies or comedies. this table shows the relative frequencies from the survey. which statements are true? select all that apply. more students prefer comedies than prefer adventure movies. less than 50% of students prefer sweet snacks. a total of 35 students prefer adventure movies. more than 50% of students prefer adventure movies. fewer students prefer sweet snacks than prefer salty snacks.
Answer
Answer:
- More students prefer comedies than prefer adventure movies.
- Less than 50% of students prefer sweet snacks.
- Fewer students prefer sweet snacks than prefer salty snacks.
Explanation:
Step1: Analyze movie - preference
The relative frequency of students who prefer comedies is 0.65 and for adventure movies is 0.35. Since 0.65>0.35, more students prefer comedies.
Step2: Analyze snack - preference for sweet snacks
The relative frequency of students who prefer sweet snacks is 0.45. Since 0.45 < 0.5, less than 50% of students prefer sweet snacks.
Step3: Analyze snack - preference comparison
The relative frequency of students who prefer sweet snacks is 0.45 and for salty snacks is 0.55. Since 0.45<0.55, fewer students prefer sweet snacks than salty snacks.
Step4: Analyze number of students for adventure movies
There are 20 students in total. The number of students who prefer adventure movies is 20×0.35 = 7, not 35.
Step5: Analyze overall movie - preference percentage
The relative frequency of students who prefer adventure movies is 0.35 which is less than 0.5, so less than 50% of students prefer adventure movies.