mrs. jonas brought a jar filled with jellybeans to school. some of her students guessed how many jellybeans…
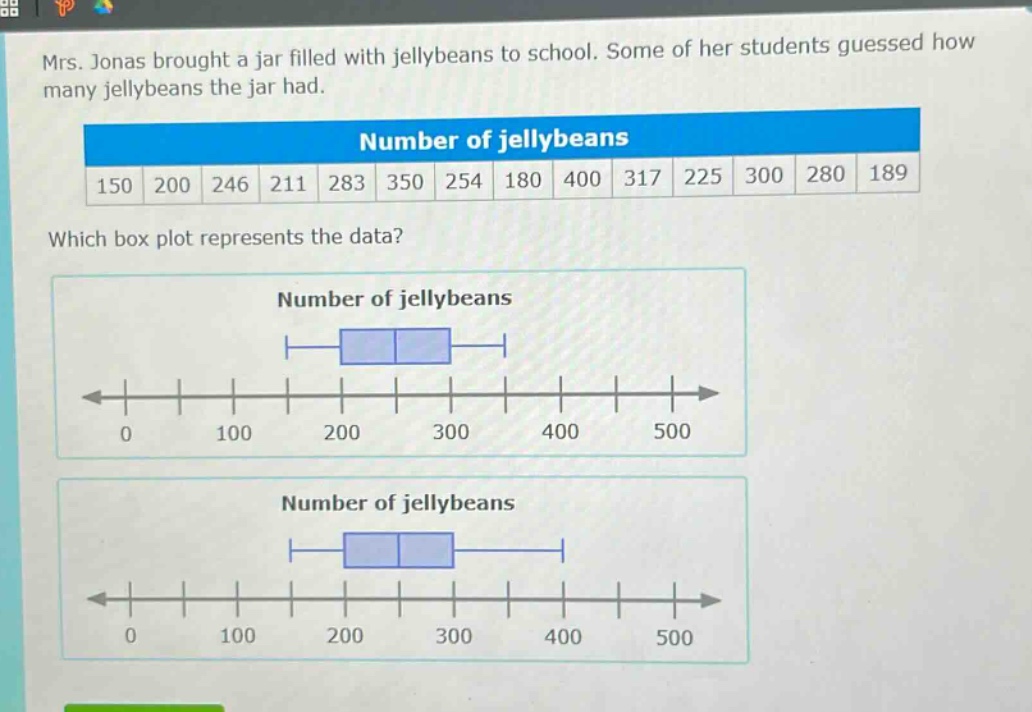
mrs. jonas brought a jar filled with jellybeans to school. some of her students guessed how many jellybeans the jar had.\nnumber of jellybeans\n150 200 246 211 283 350 254 180 400 317 225 300 280 189\nwhich box plot represents the data?\nnumber of jellybeans\nnumber of jellybeans
Answer
Explanation:
Step1: Arrange data in ascending order
150, 180, 189, 200, 211, 225, 246, 254, 280, 283, 300, 317, 350, 400
Step2: Find the minimum value
The minimum value is 150.
Step3: Find the first - quartile ($Q_1$)
The median of the lower half of the data. The lower half is 150, 180, 189, 200, 211, 225, 246. The median of this set ($Q_1$) is 200.
Step4: Find the median ($Q_2$)
The median of the whole data set. Since there are 14 data points, the median is the average of the 7th and 8th values. $\frac{246 + 254}{2}=250$.
Step5: Find the third - quartile ($Q_3$)
The median of the upper half of the data. The upper half is 254, 280, 283, 300, 317, 350, 400. The median of this set ($Q_3$) is 300.
Step6: Find the maximum value
The maximum value is 400.
The box - plot should have the left - most whisker at 150, the left side of the box at 200, the line inside the box at 250, the right side of the box at 300, and the right - most whisker at 400.
Answer:
We need to compare the calculated values (min = 150, $Q_1$ = 200, $Q_2$ = 250, $Q_3$ = 300, max = 400) with the given box - plots to determine the correct one. Without the actual visual comparison of the two provided box - plots based on these values, we can't give a definite choice from the two box - plots shown. But the correct box - plot should have the left end of the box at 200, the line in the box at 250, the right end of the box at 300, the left whisker starting at 150 and the right whisker ending at 400.