ms. millers english class kept track of how many books they read last school year. books read 41 24 97 67…
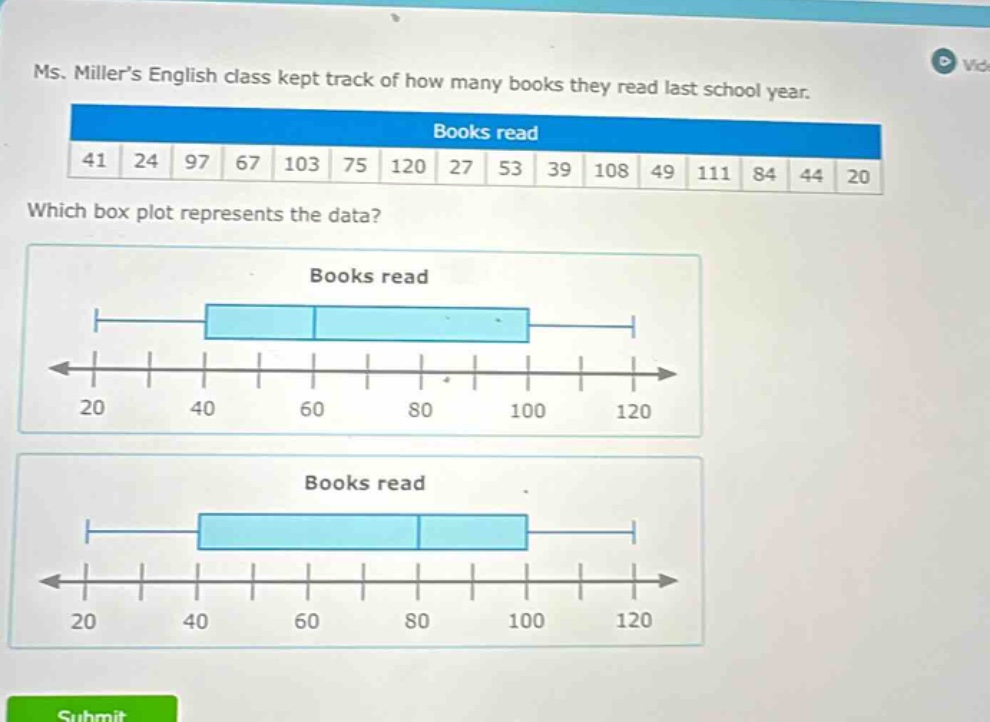
ms. millers english class kept track of how many books they read last school year. books read 41 24 97 67 103 75 120 27 53 39 108 49 111 84 44 20 which box plot represents the data? books read 20 40 60 80 100 120 books read 20 40 60 80 100 120
Answer
Answer:
To determine which box - plot represents the data, we need to find the five - number summary (minimum, first quartile $Q_1$, median, third quartile $Q_3$, maximum).
-
First, order the data: $20,24,27,39,41,44,49,53,67,75,84,97,103,108,111,120$.
- Minimum: The smallest value in the ordered data set is $20$.
- Maximum: The largest value in the ordered data set is $120$.
- Median ($Q_2$): Since there are $n = 16$ data points, the median is the average of the $\frac{n}{2}=8$th and $(\frac{n}{2}+1) = 9$th ordered values.
- The 8th value is $53$ and the 9th value is $67$. So, the median $Q_2=\frac{53 + 67}{2}=60$.
- First quartile ($Q_1$): The lower half of the data is $20,24,27,39,41,44,49,53$. Since there are $n_1 = 8$ data points in the lower half, the first quartile is the average of the $\frac{n_1}{2}=4$th and $(\frac{n_1}{2}+1)=5$th ordered values in the lower - half.
- The 4th value is $39$ and the 5th value is $41$. So, $Q_1=\frac{39 + 41}{2}=40$.
- Third quartile ($Q_3$): The upper half of the data is $67,75,84,97,103,108,111,120$. Since there are $n_2 = 8$ data points in the upper half, the third quartile is the average of the $\frac{n_2}{2}=4$th and $(\frac{n_2}{2}+1)=5$th ordered values in the upper - half.
- The 4th value is $97$ and the 5th value is $103$. So, $Q_3=\frac{97+103}{2}=100$.
-
Analyze the box - plots:
- In a box - plot, the left - most whisker represents the minimum value ($20$), the left side of the box represents $Q_1$ ($40$), the line inside the box represents the median ($60$), the right side of the box represents $Q_3$ ($100$), and the right - most whisker represents the maximum value ($120$).
- The box - plot where the left side of the box is at $40$, the line in the box is at $60$, the right side of the box is at $100$, with whiskers extending to $20$ and $120$ is the correct one.
The box - plot with the left side of the box at $40$, the median line at $60$, the right side of the box at $100$, and whiskers from $20$ to $120$ represents the data.
Explanation:
Step1: Order the data
$20,24,27,39,41,44,49,53,67,75,84,97,103,108,111,120$
Step2: Find the minimum
The minimum is $20$.
Step3: Find the maximum
The maximum is $120$.
Step4: Calculate the median
$Q_2=\frac{53 + 67}{2}=60$
Step5: Calculate the first quartile
$Q_1=\frac{39 + 41}{2}=40$
Step6: Calculate the third quartile
$Q_3=\frac{97+103}{2}=100$
Step7: Match with box - plots
Match the values of minimum, $Q_1$, median, $Q_3$, maximum to the box - plots.