ms. redmon gave her theater students an assignment to memorize a dramatic monologue to present to the rest…
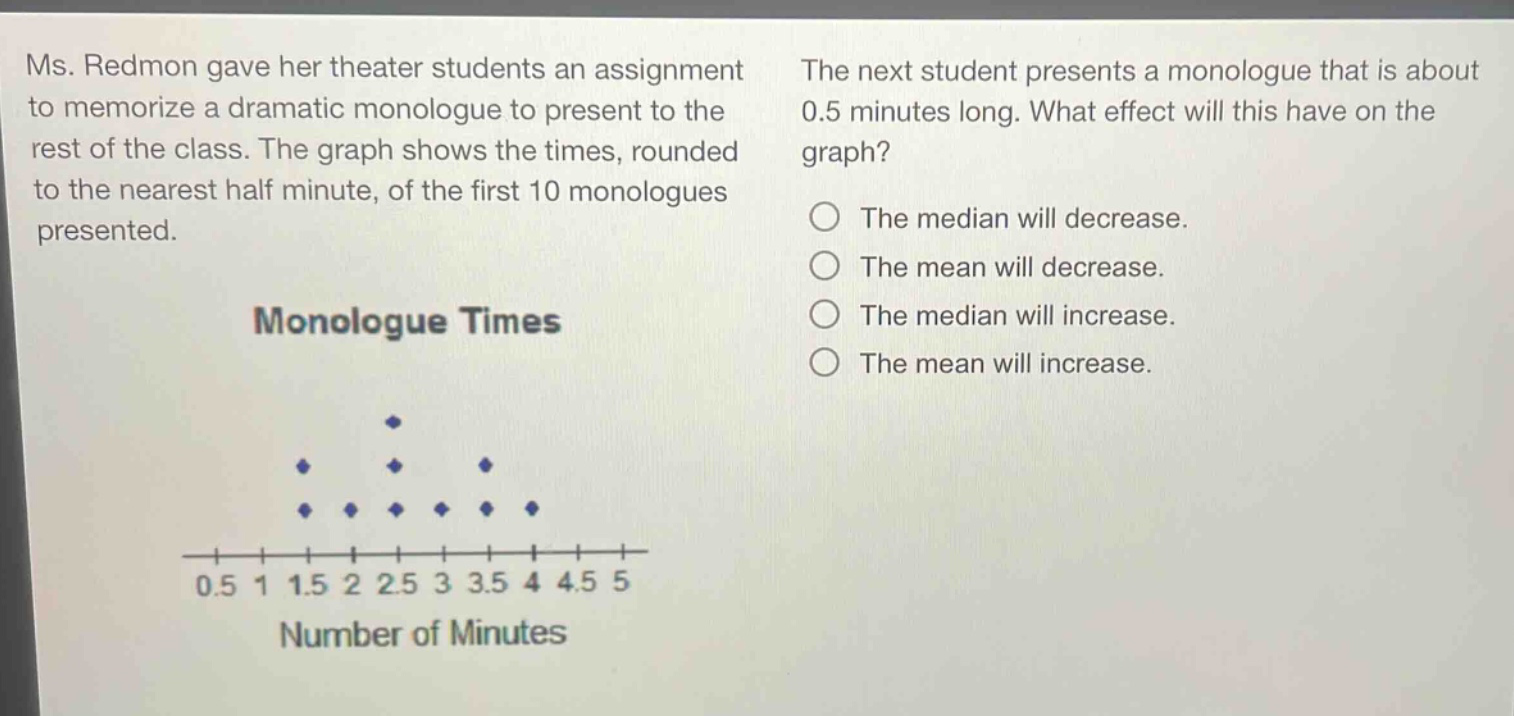
ms. redmon gave her theater students an assignment to memorize a dramatic monologue to present to the rest of the class. the graph shows the times, rounded to the nearest half minute, of the first 10 monologues presented. the next student presents a monologue that is about 0.5 minutes long. what effect will this have on the graph? the median will decrease. the mean will decrease. the median will increase. the mean will increase. monologue times 0.5 1 1.5 2 2.5 3 3.5 4 4.5 5 number of minutes
Answer
Answer:
The mean will decrease.
Explanation:
Step1: Recall mean and median concepts
Mean is sum of values/number of values. Median is middle - value (for odd number of data) or average of two middle - values (for even number of data).
Step2: Analyze the data
The existing 10 monologue times seem to be mostly above 1.5 minutes. Adding a 0.5 - minute monologue will decrease the sum of all times.
Step3: Consider the impact on mean
Since mean = $\frac{\text{sum of values}}{\text{number of values}}$, with an increased number of values (from 10 to 11) and a decreased sum, the mean will decrease.
Step4: Consider the impact on median
For 10 data points, median is average of 5th and 6th ordered values. For 11 data points, median is 6th ordered value. Since 0.5 is a low value, it may not change the position of the middle - value(s) significantly, so median may not change or change minimally compared to the mean. So the mean will decrease.