myrna is conducting a survey on poultry farming, specifically focusing on egg - laying hens. the following…
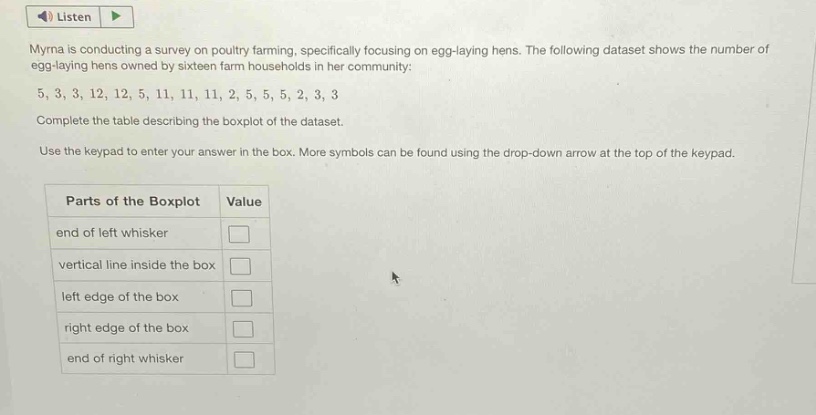
myrna is conducting a survey on poultry farming, specifically focusing on egg - laying hens. the following dataset shows the number of egg - laying hens owned by sixteen farm households in her community: 5, 3, 3, 12, 12, 5, 11, 11, 11, 2, 5, 5, 5, 2, 3, 3. complete the table describing the boxplot of the dataset. use the keypad to enter your answer in the box. more symbols can be found using the drop - down arrow at the top of the keypad. parts of the boxplot value end of left whisker vertical line inside the box left edge of the box right edge of the box end of right whisker
Answer
Explanation:
Step1: Arrange data in ascending order
2, 2, 2, 3, 3, 3, 3, 5, 5, 5, 5, 5, 11, 11, 12, 12
Step2: Find the minimum (end of left - whisker)
The minimum value of the dataset is 2.
Step3: Find the first quartile ($Q_1$, left edge of the box)
There are $n = 16$ data points. The position of $Q_1$ is $\frac{n + 1}{4}=\frac{16+1}{4}=4.25$. So, $Q_1=3$.
Step4: Find the median (vertical line inside the box)
The position of the median for $n = 16$ (even number of data points) is $\frac{n}{2}=8$ and $\frac{n}{2}+1 = 9$. The median is $\frac{5 + 5}{2}=5$.
Step5: Find the third quartile ($Q_3$, right edge of the box)
The position of $Q_3$ is $\frac{3(n + 1)}{4}=\frac{3\times(16 + 1)}{4}=12.75$. So, $Q_3 = 11$.
Step6: Find the maximum (end of right - whisker)
The maximum value of the dataset is 12.
Answer:
| Parts of the Boxplot | Value |
|---|---|
| end of left whisker | 2 |
| vertical line inside the box | 5 |
| left edge of the box | 3 |
| right edge of the box | 11 |
| end of right whisker | 12 |