natalia recorded daily visitors to her new website. the data for the first 9 days is shown below. 25, 31…
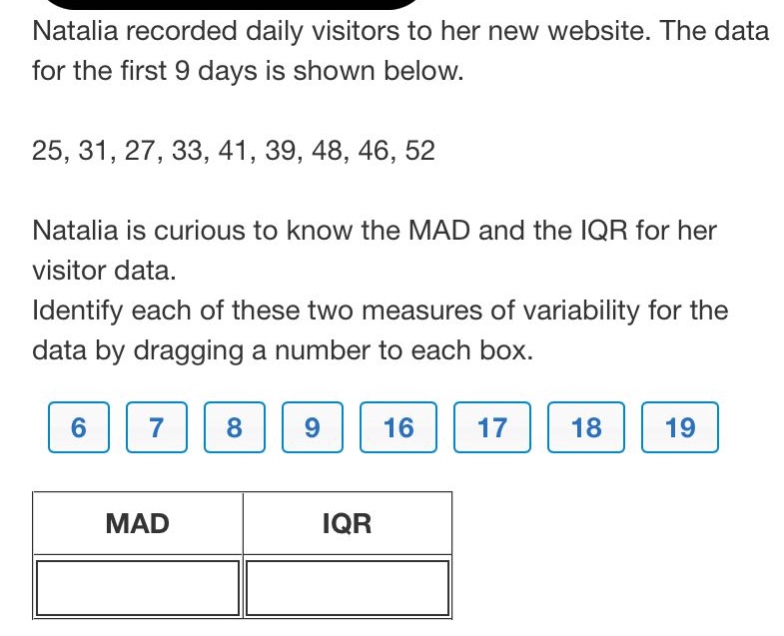
natalia recorded daily visitors to her new website. the data for the first 9 days is shown below. 25, 31, 27, 33, 41, 39, 48, 46, 52 natalia is curious to know the mad and the iqr for her visitor data. identify each of these two measures of variability for the data by dragging a number to each box. 6 7 8 9 16 17 18 19 mad iqr
Answer
Explanation:
Step1: Sort the data
$25, 27, 31, 33, 39, 41, 46, 48, 52$
Step2: Calculate the mean
$\bar{x}=\frac{25 + 27+31+33+39+41+46+48+52}{9}=\frac{342}{9} = 38$
Step3: Calculate the absolute - deviations
$|25 - 38|=13$, $|27 - 38| = 11$, $|31 - 38|=7$, $|33 - 38| = 5$, $|39 - 38|=1$, $|41 - 38| = 3$, $|46 - 38|=8$, $|48 - 38| = 10$, $|52 - 38|=14$
Step4: Calculate the MAD
$MAD=\frac{13 + 11+7+5+1+3+8+10+14}{9}=\frac{72}{9}=8$
Step5: Find the median (Q2)
The median of the 9 - data set is the 5th value. So, $Q2 = 39$
Step6: Find Q1 and Q3
The lower half of the data is $25, 27, 31, 33$. The median of the lower half ($Q1$) is $\frac{27 + 31}{2}=29$ The upper half of the data is $41, 46, 48, 52$. The median of the upper half ($Q3$) is $\frac{46+48}{2}=47$
Step7: Calculate the IQR
$IQR=Q3 - Q1=47 - 29 = 18$
Answer:
MAD: 8 IQR: 18