the national distribution of fatal work injuries in a country is shown in the table to the right under…
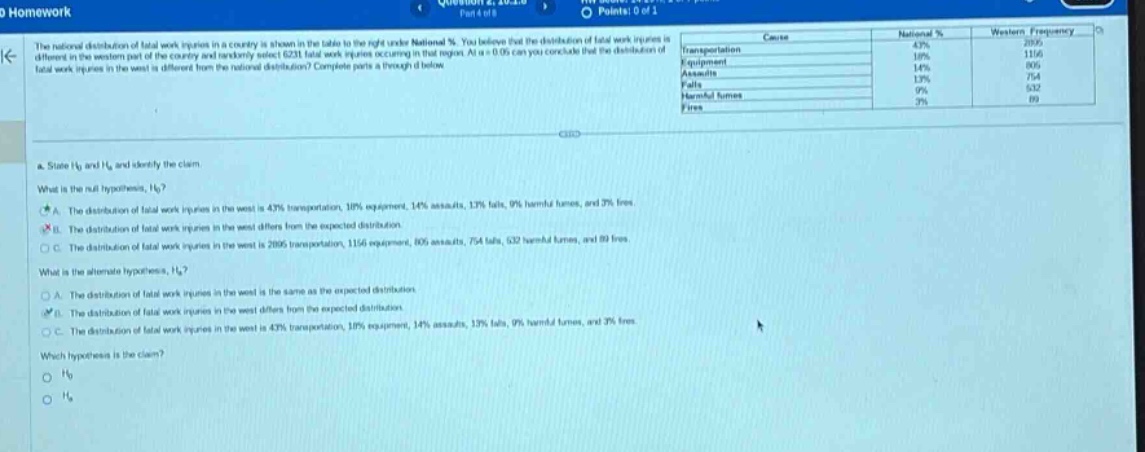
the national distribution of fatal work injuries in a country is shown in the table to the right under national %. you believe that the distribution of fatal work injuries is different in the western part of the country and randomly select 6231 total work injuries occurring in that region. at \\(\\alpha = 0.05\\) can you conclude that the distribution of fatal work injuries in the west is different from the national distribution? complete parts a through d below.\n\na. state \\(h_0\\) and \\(h_a\\) and identify the claim.\nwhat is the null hypothesis, \\(h_0\\)?\na. the distribution of fatal work injuries in the west is 43% transportation, 10% equipment, 14% assaults, 13% falls, 9% harmful fumes, and 3% fires.\nb. the distribution of fatal work injuries in the west differs from the expected distribution.\nc. the distribution of fatal work injuries in the west is 2095 transportation, 1116 equipment, 869 assaults, 754 falls, 632 harmful fumes, and 89 fires.\nwhat is the alternate hypothesis, \\(h_a\\)?\na. the distribution of fatal work injuries in the west is the same as the expected distribution.\nb. the distribution of fatal work injuries in the west differs from the expected distribution.\nc. the distribution of fatal work injuries in the west is 43% transportation, 10% equipment, 14% assaults, 13% falls, 9% harmful fumes, and 3% fires.\nwhich hypothesis is the claim?\n\\(h_0\\)\n\\(h_a\\)
Answer
Explanation:
Step1: Define null and alternative hypotheses
The null hypothesis $H_0$ is usually a statement of no - difference. Here, it is that the distribution of fatal work injuries in the west is the same as the expected (national) distribution. The alternative hypothesis $H_1$ is the claim that there is a difference. $H_0$: The distribution of fatal work injuries in the west is the same as the expected distribution. $H_1$: The distribution of fatal work injuries in the west differs from the expected distribution. The claim is the alternative hypothesis $H_1$.
Answer:
The null hypothesis $H_0$: The distribution of fatal work injuries in the west is the same as the expected distribution. The alternative hypothesis $H_1$: The distribution of fatal work injuries in the west differs from the expected distribution. The claim is $H_1$.