4. nike has created a new running shoe that they believe is faster, so they want to test if the new shoes…
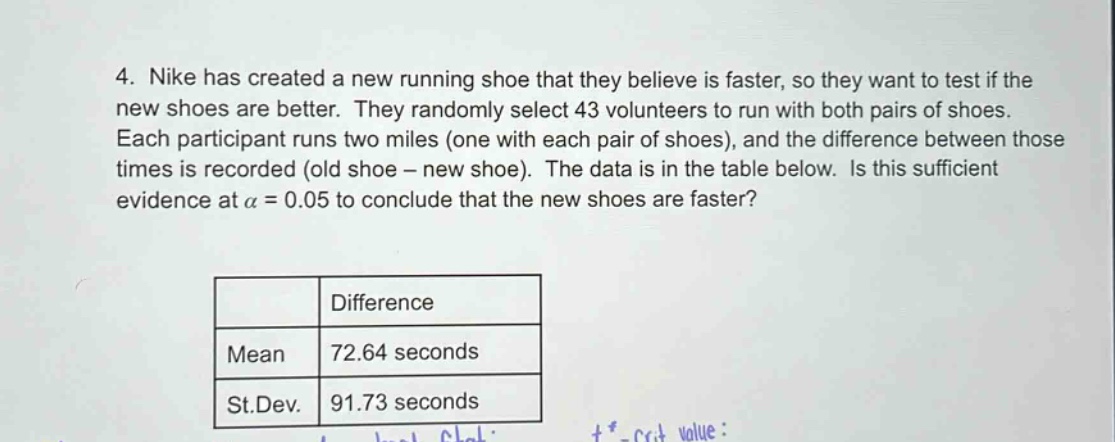
4. nike has created a new running shoe that they believe is faster, so they want to test if the new shoes are better. they randomly select 43 volunteers to run with both pairs of shoes. each participant runs two miles (one with each pair of shoes), and the difference between those times is recorded (old shoe - new shoe). the data is in the table below. is this sufficient evidence at α = 0.05 to conclude that the new shoes are faster?\n\n| |difference|\n|--|--|\n|mean|72.64 seconds|\n|st.dev.|91.73 seconds|
Answer
Explanation:
Step1: State the hypotheses
Let $\mu_d$ be the population - mean difference (old shoe - new shoe). $H_0:\mu_d\leq0$ (new shoes are not faster), $H_1:\mu_d > 0$ (new shoes are faster)
Step2: Calculate the test - statistic
The formula for the one - sample t - test statistic for paired data is $t=\frac{\bar{d}-\mu_d}{s_d/\sqrt{n}}$, where $\bar{d}$ is the sample mean difference, $\mu_d$ is the hypothesized population mean difference under the null hypothesis, $s_d$ is the sample standard deviation of the differences, and $n$ is the sample size. We have $\bar{d} = 72.64$, $\mu_d = 0$ (under $H_0$), $s_d=91.73$, and $n = 43$. $t=\frac{72.64 - 0}{91.73/\sqrt{43}}\approx\frac{72.64}{91.73/6.5574}\approx\frac{72.64}{13.99}\approx5.19$
Step3: Determine the degrees of freedom and critical value
The degrees of freedom for a one - sample t - test for paired data is $df=n - 1=43-1 = 42$. For a one - tailed test with $\alpha = 0.05$ and $df = 42$, using a t - distribution table or a calculator, the critical value $t_{\alpha,df}=t_{0.05,42}\approx1.682$
Step4: Make a decision
Since the calculated test - statistic $t\approx5.19>t_{0.05,42}\approx1.682$, we reject the null hypothesis.
Answer:
Yes, there is sufficient evidence at $\alpha = 0.05$ to conclude that the new shoes are faster.