nine adults were asked how many different jobs they have had. their answers are shown in the dot plot below…
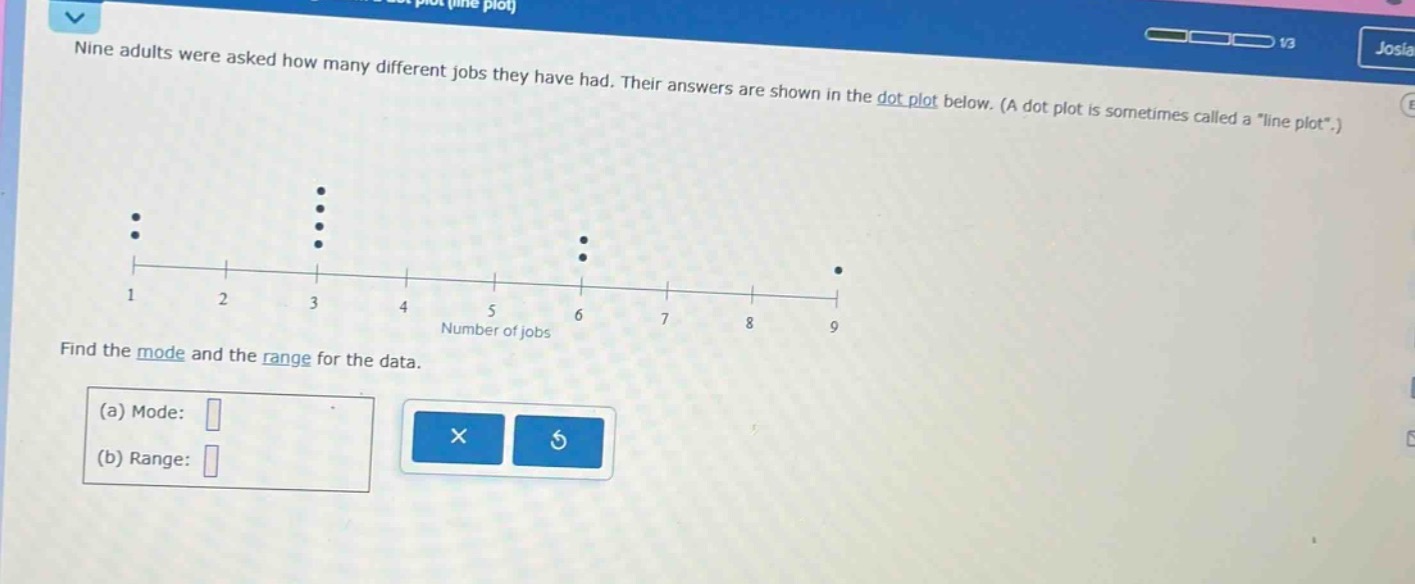
nine adults were asked how many different jobs they have had. their answers are shown in the dot plot below. (a dot plot is sometimes called a \line plot\.) find the mode and the range for the data. (a) mode: (b) range:
Answer
Explanation:
Step1: Recall mode definition
The mode is the value that appears most frequently. In the dot - plot, the number 3 has 4 dots, which is more than any other number.
Step2: Recall range formula
The range is calculated as the difference between the maximum and minimum values. The maximum value is 9 and the minimum value is 1. So, range = 9 - 1.
Answer:
(a) Mode: 3 (b) Range: 8