a normal distribution curve, where $\bar{x}=70$ and $sigma = 15$, was created by a teacher using her…
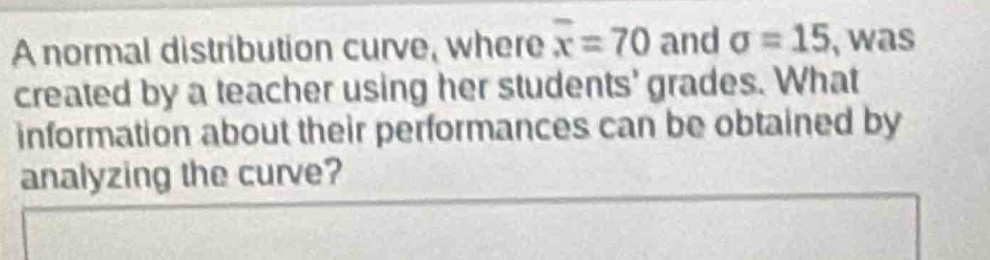
a normal distribution curve, where $\bar{x}=70$ and $sigma = 15$, was created by a teacher using her students grades. what information about their performances can be obtained by analyzing the curve?
Answer
Brief Explanations:
In a normal - distribution curve for student grades, the mean ($\bar{x} = 70$) represents the average grade. The standard deviation ($\sigma=15$) shows the spread of grades. We can determine the proportion of students within certain grade ranges. For example, about 68% of students' grades are within one - standard deviation of the mean (i.e., between $70 - 15=55$ and $70 + 15 = 85$), about 95% are within two - standard deviations (between $70-2\times15 = 40$ and $70 + 2\times15=100$), and about 99.7% are within three - standard deviations. We can also compare individual students' grades to the overall distribution to see how well they performed relative to their peers.
Answer:
We can obtain information about the average grade (mean = 70), the spread of grades (standard deviation = 15), the proportion of students within different grade ranges (e.g., 68% within one - standard deviation, 95% within two - standard deviations, 99.7% within three - standard deviations), and how individual students' grades compare to the overall distribution.