the number of bus riders was recorded on one route. the data have these values: minimum = 18, lower quartile…
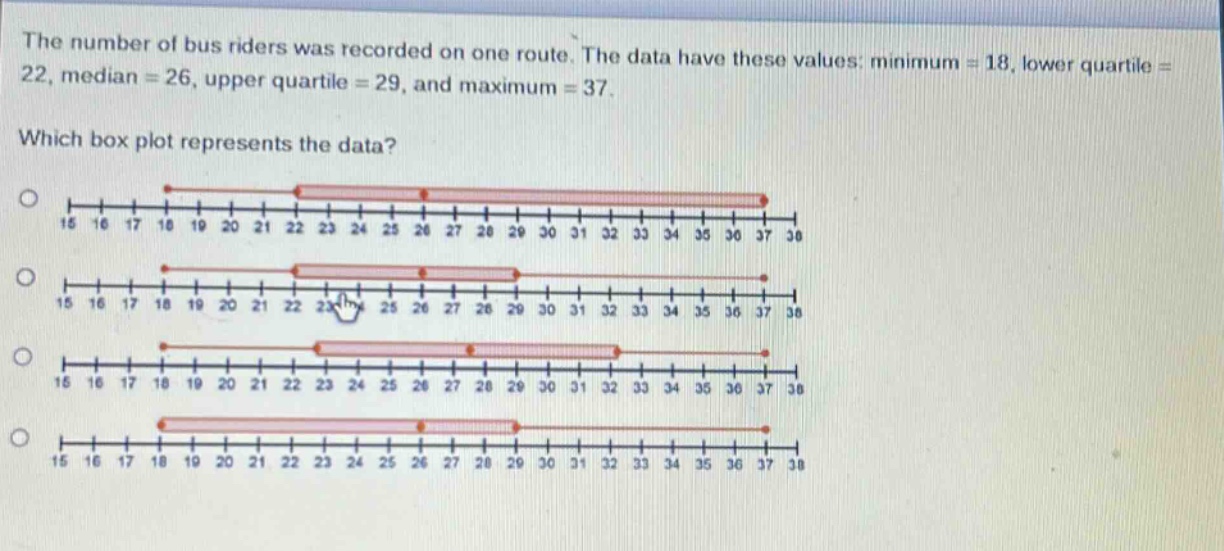
the number of bus riders was recorded on one route. the data have these values: minimum = 18, lower quartile = 22, median = 26, upper quartile = 29, and maximum = 37. which box plot represents the data?
Answer
Explanation:
Step1: Recall box - plot components
A box - plot has a left - most point at the minimum value, the left - edge of the box at the lower quartile, a line inside the box at the median, the right - edge of the box at the upper quartile, and a right - most point at the maximum value.
Step2: Identify values
We are given minimum = 18, lower quartile = 22, median = 26, upper quartile = 29, and maximum = 37.
Step3: Check each option
We look for a box - plot where the left - most point is at 18, the left - edge of the box is at 22, the line inside the box is at 26, the right - edge of the box is at 29, and the right - most point is at 37.
Answer:
The box - plot where the left - most dot is at 18, the left - side of the box is at 22, the line in the box is at 26, the right - side of the box is at 29, and the right - most dot is at 37 (the third option from the top in the image).