3. the number of calories in each sandwich listed on the menu at a fast food restaurant: {320, 420, 580…
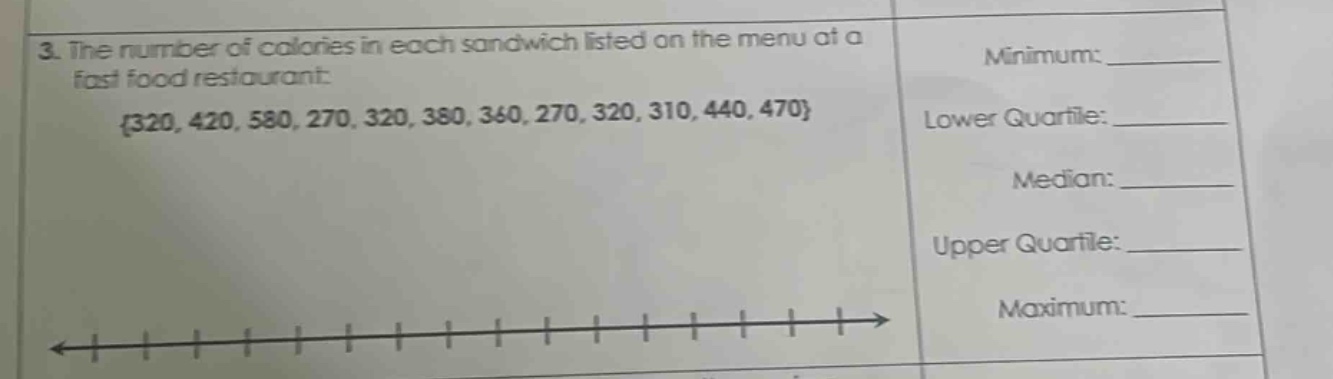
3. the number of calories in each sandwich listed on the menu at a fast food restaurant: {320, 420, 580, 270, 320, 380, 360, 270, 320, 310, 440, 470} minimum: ____ lower quartile: ____ median: ____ upper quartile: ____ maximum: ____
Answer
Explanation:
Step1: Sort the data
Sort the set ${320, 420, 580, 270, 320, 380, 360, 270, 320, 310, 440, 470}$ in ascending - order: ${270, 270, 310, 320, 320, 320, 360, 380, 420, 440, 470, 580}$.
Step2: Find the minimum
The minimum value is the first number in the sorted list. So, the minimum is $270$.
Step3: Find the lower quartile
There are $n = 12$ data - points. The position of the lower quartile ($Q_1$) is $\frac{n + 1}{4}=\frac{12+1}{4}=3.25$. The lower quartile is $310+(320 - 310)\times0.25=312.5$.
Step4: Find the median
The position of the median for $n = 12$ (an even number of data - points) is $\frac{n}{2}=6$ and $\frac{n}{2}+1 = 7$. The median is $\frac{320 + 360}{2}=340$.
Step5: Find the upper quartile
The position of the upper quartile ($Q_3$) is $\frac{3(n + 1)}{4}=\frac{3\times(12 + 1)}{4}=9.75$. The upper quartile is $420+(440 - 420)\times0.75=435$.
Step6: Find the maximum
The maximum value is the last number in the sorted list. So, the maximum is $580$.
Answer:
Minimum: $270$ Lower Quartile: $312.5$ Median: $340$ Upper Quartile: $435$ Maximum: $580$