4. the number of candy bars mariah sold over the course of two weeks was 10, 12, 9, 14, 8, 12, 14, 7, 11…
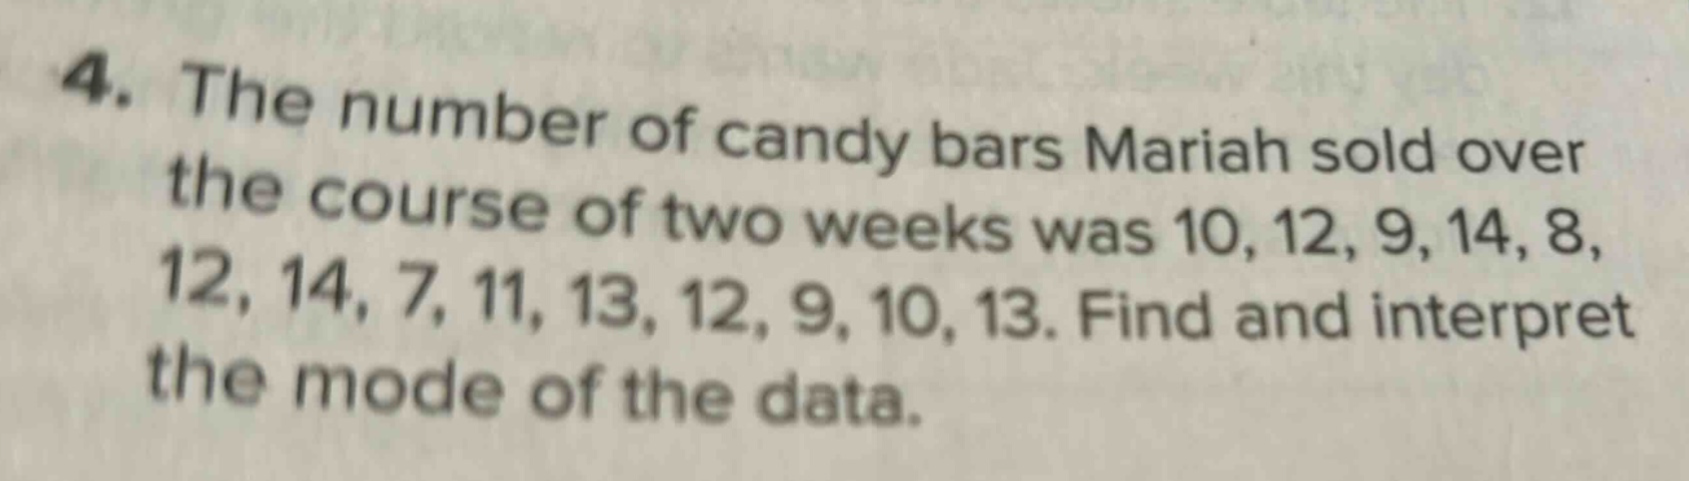
4. the number of candy bars mariah sold over the course of two weeks was 10, 12, 9, 14, 8, 12, 14, 7, 11, 13, 12, 9, 10, 13. find and interpret the mode of the data.
Answer
Explanation:
Step1: Recall the definition of mode
The mode is the number that appears most frequently in a data - set.
Step2: Count the frequency of each number
- 7 appears 1 time.
- 8 appears 1 time.
- 9 appears 2 times.
- 10 appears 2 times.
- 11 appears 1 time.
- 12 appears 4 times.
- 13 appears 2 times.
- 14 appears 2 times.
Step3: Determine the mode
Since 12 appears the most frequently (4 times), the mode is 12.
Step4: Interpret the mode
The number 12 represents the number of candy - bars that Mariah sold on the greatest number of days over the two - week period.
Answer:
The mode is 12. It means that Mariah sold 12 candy bars on the greatest number of days over the two - week period.