the number of cars sold at a dealership over several weeks is given below. 14, 23, 31, 29, 33 what is the…
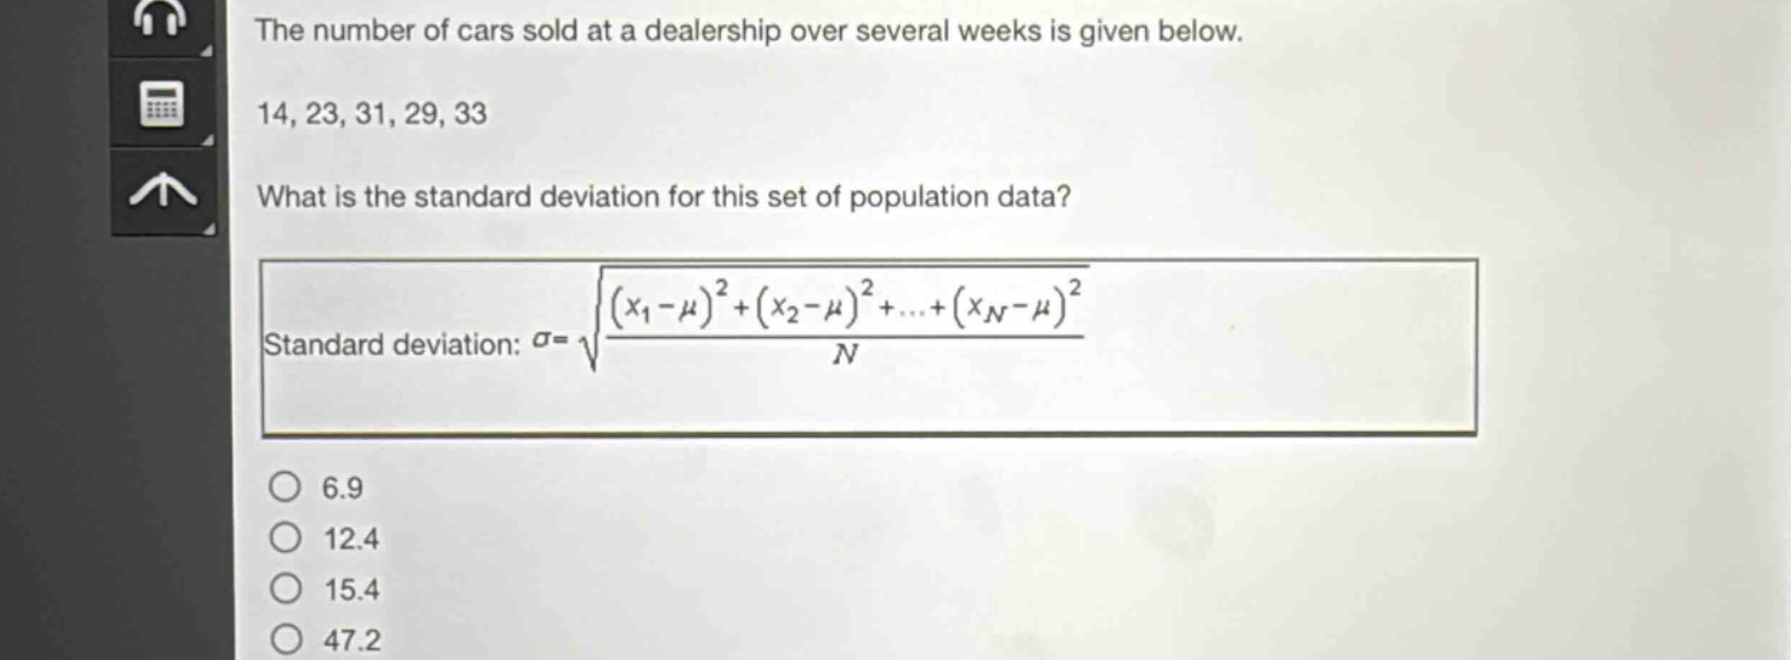
the number of cars sold at a dealership over several weeks is given below. 14, 23, 31, 29, 33 what is the standard deviation for this set of population data? standard deviation: $sigma = sqrt{\frac{(x_1-mu)^2+(x_2 - mu)^2+cdots+(x_n-mu)^2}{n}}$ 6.9 12.4 15.4 47.2
Answer
Explanation:
Step1: Calculate the mean $\mu$
$\mu=\frac{14 + 23+31+29+33}{5}=\frac{130}{5}=26$
Step2: Calculate the squared - differences
$(14 - 26)^2=(-12)^2 = 144$ $(23 - 26)^2=(-3)^2 = 9$ $(31 - 26)^2=(5)^2 = 25$ $(29 - 26)^2=(3)^2 = 9$ $(33 - 26)^2=(7)^2 = 49$
Step3: Calculate the variance
$\text{Variance}=\frac{144 + 9+25+9+49}{5}=\frac{236}{5}=47.2$
Step4: Calculate the standard deviation
$\sigma=\sqrt{47.2}\approx6.9$
Answer:
6.9