the number of hours worked by each of the employees last week at two stores are listed below.\nhours worked…
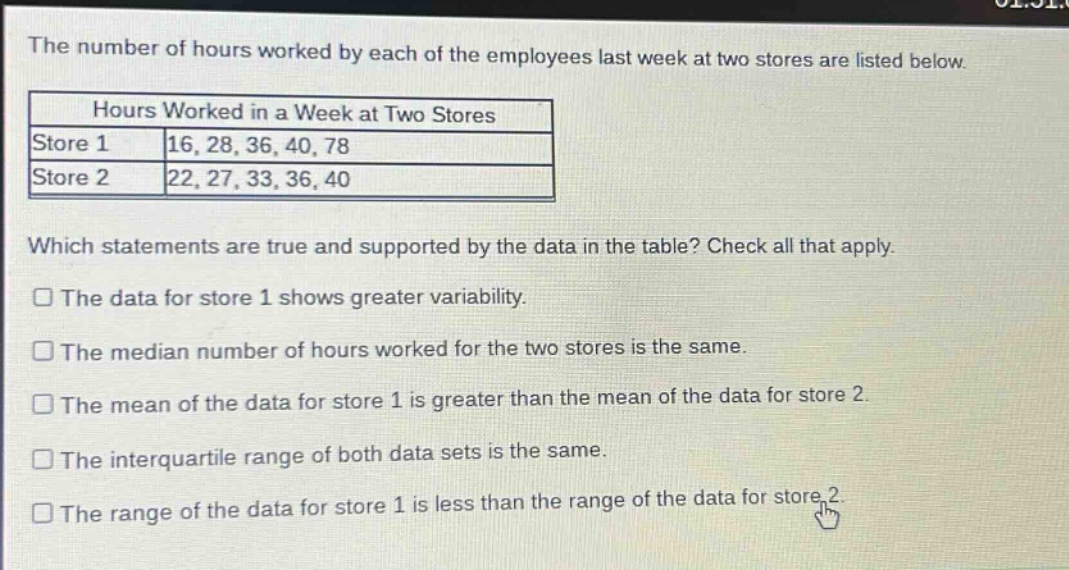
the number of hours worked by each of the employees last week at two stores are listed below.\nhours worked in a week at two stores\nstore 1 16, 28, 36, 40, 78\nstore 2 22, 27, 33, 36, 40\nwhich statements are true and supported by the data in the table? check all that apply.\nthe data for store 1 shows greater variability.\nthe median number of hours worked for the two stores is the same.\nthe mean of the data for store 1 is greater than the mean of the data for store 2.\nthe interquartile range of both data sets is the same.\nthe range of the data for store 1 is less than the range of the data for store 2.
Answer
Explanation:
Step1: Calculate range for each store
For store 1: Range = 78 - 16 = 62. For store 2: Range = 40 - 22 = 18. Since 62>18, store 1 has greater range and thus greater variability.
Step2: Calculate median for each store
Store 1 data in ascending - order: 16, 28, 36, 40, 78. Median (middle value) is 36. Store 2 data in ascending - order: 22, 27, 33, 36, 40. Median is 33. So, medians are not the same.
Step3: Calculate mean for each store
Mean of store 1: $\frac{16 + 28+36 + 40+78}{5}=\frac{198}{5}=39.6$. Mean of store 2: $\frac{22 + 27+33 + 36+40}{5}=\frac{158}{5}=31.6$. So, mean of store 1 is greater than mean of store 2.
Step4: Calculate inter - quartile range (IQR) for each store
For store 1: First, find Q1 and Q3. The data set is 16, 28, 36, 40, 78. Q1 is the median of the lower half (16, 28), so Q1 = 22. Q3 is the median of the upper half (40, 78), so Q3 = 59. IQR = Q3 - Q1 = 59 - 22 = 37. For store 2: The data set is 22, 27, 33, 36, 40. Q1 is the median of the lower half (22, 27), so Q1 = 24.5. Q3 is the median of the upper half (36, 40), so Q3 = 38. IQR = Q3 - Q1 = 38 - 24.5 = 13.5. IQRs are not the same.
Answer:
The data for store 1 shows greater variability. The mean of the data for store 1 is greater than the mean of the data for store 2.