the number of miles a salesperson drives per year is shown on the scatterplot below. if the trend continues…
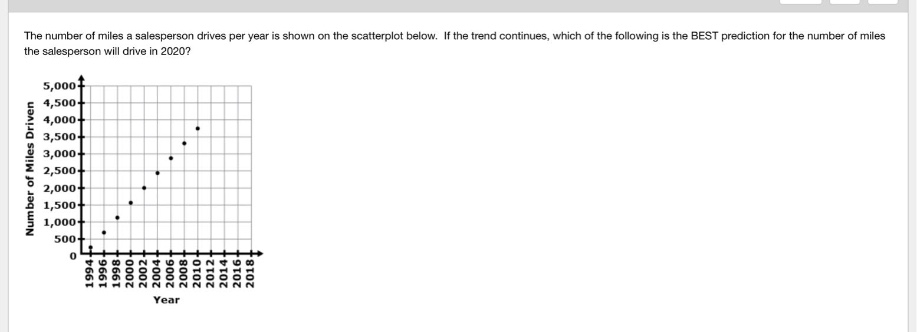
the number of miles a salesperson drives per year is shown on the scatterplot below. if the trend continues, which of the following is the best prediction for the number of miles the salesperson will drive in 2020?
Answer
Explanation:
Step1: Identify two points to calculate the slope
From the scatterplot, the points $(1994, 250)$ and $(2010, 3750)$ lie on the trend line.
Step2: Calculate the rate of change (slope)
$$m = \frac{3750 - 250}{2010 - 1994} = \frac{3500}{16} = 218.75 \text{ miles per year}$$
Step3: Determine the linear equation
Using the point-slope form $y - y_1 = m(x - x_1)$ with point $(2010, 3750)$: $$y - 3750 = 218.75(x - 2010)$$
Step4: Predict the value for the year 2020
Substitute $x = 2020$ into the equation: $$y = 3750 + 218.75(2020 - 2010)$$
Step5: Solve for the final prediction
$$y = 3750 + 218.75(10) = 3750 + 2187.5 = 5937.5$$
Answer:
Approximately 6,000 miles