number of properties\n13\n12\n11\n10\n9\n1 - 30 31 - 60 61 - 91\nnumber of days to sell\nwhy might the graph…
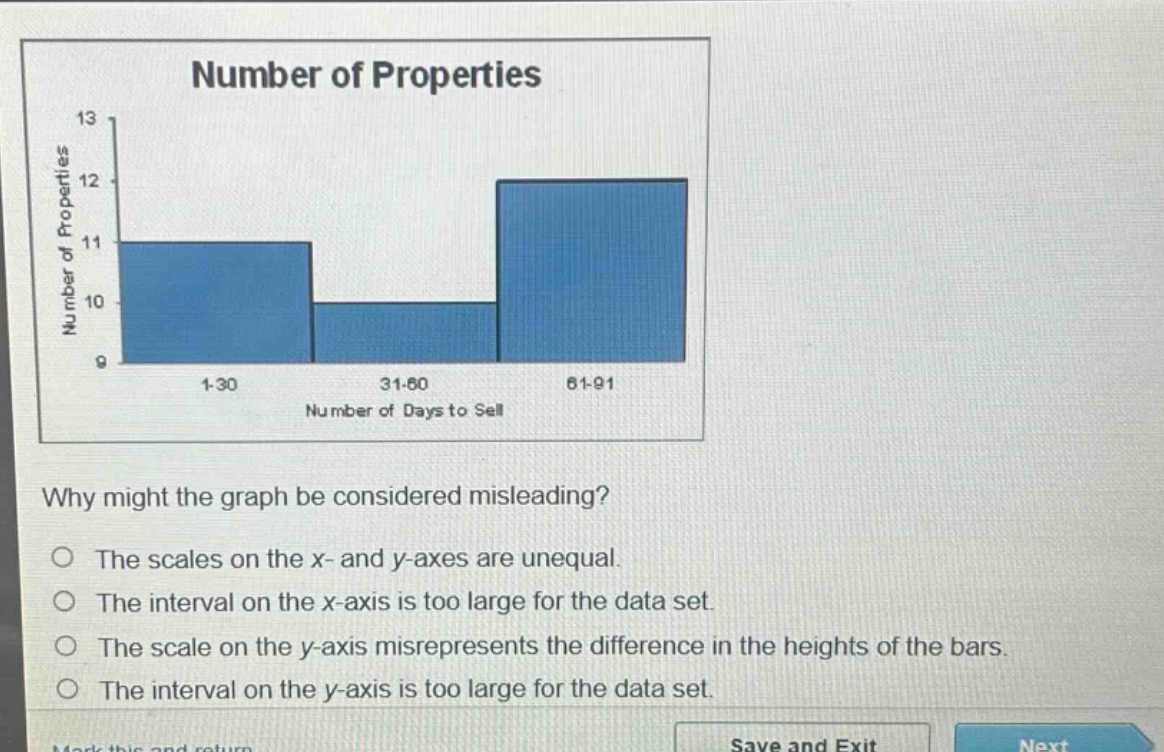
number of properties\n13\n12\n11\n10\n9\n1 - 30 31 - 60 61 - 91\nnumber of days to sell\nwhy might the graph be considered misleading?\nthe scales on the x - and y - axes are unequal.\nthe interval on the x - axis is too large for the data set.\nthe scale on the y - axis misrepresents the difference in the heights of the bars.\nthe interval on the y - axis is too large for the data set.
Answer
Brief Explanations:
The y - axis starts at 9 instead of 0. This makes the differences between the bar - heights seem more significant than they actually are. For example, the difference between 10 and 11 seems larger than it would if the y - axis started at 0.
Answer:
The scale on the y - axis misrepresents the difference in the heights of the bars.