the number of questions that students answered incorrectly on the last quiz is shown in the dot plot below…
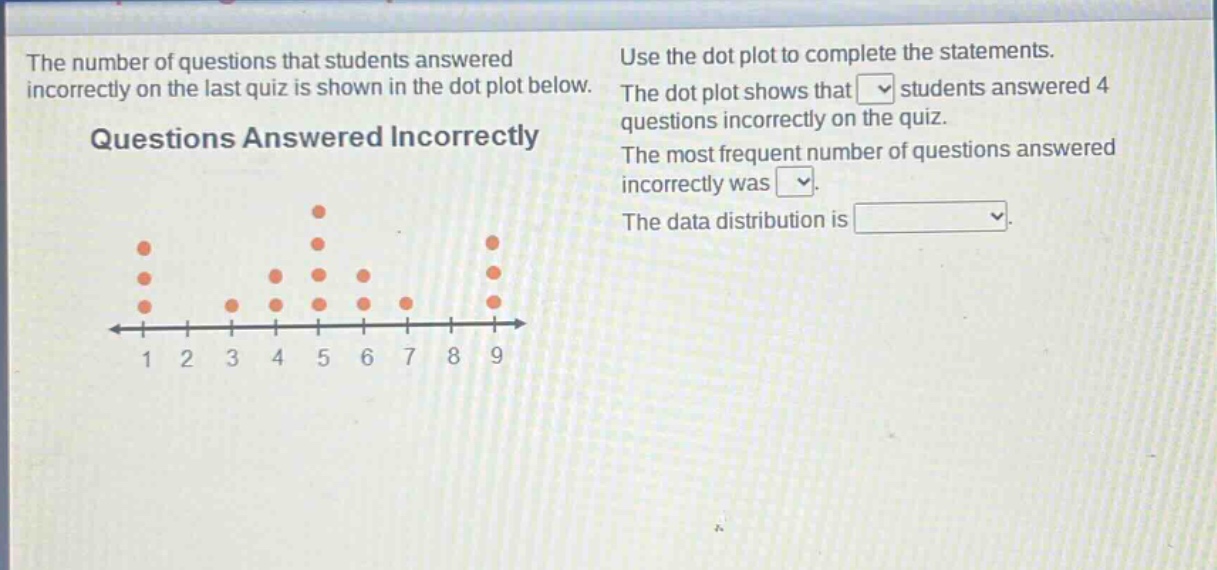
the number of questions that students answered incorrectly on the last quiz is shown in the dot plot below. questions answered incorrectly use the dot plot to complete the statements. the dot plot shows that students answered 4 questions incorrectly on the quiz. the most frequent number of questions answered incorrectly was. the data distribution is.
Answer
Explanation:
Step1: Count dots for 4
Count the number of dots above the number 4 on the dot - plot. There are 2 dots.
Step2: Find most frequent number
The number with the most dots above it is 5, as there are 4 dots above 5.
Step3: Determine data - distribution
The data has a single peak at 5. So, it is symmetric (since the data tapers off evenly on both sides of the peak).
Answer:
The dot plot shows that 2 students answered 4 questions incorrectly on the quiz. The most frequent number of questions answered incorrectly was 5. The data distribution is symmetric.