the number of text messages that reza sent each day so far in this billing cycle is shown on the dot plot…
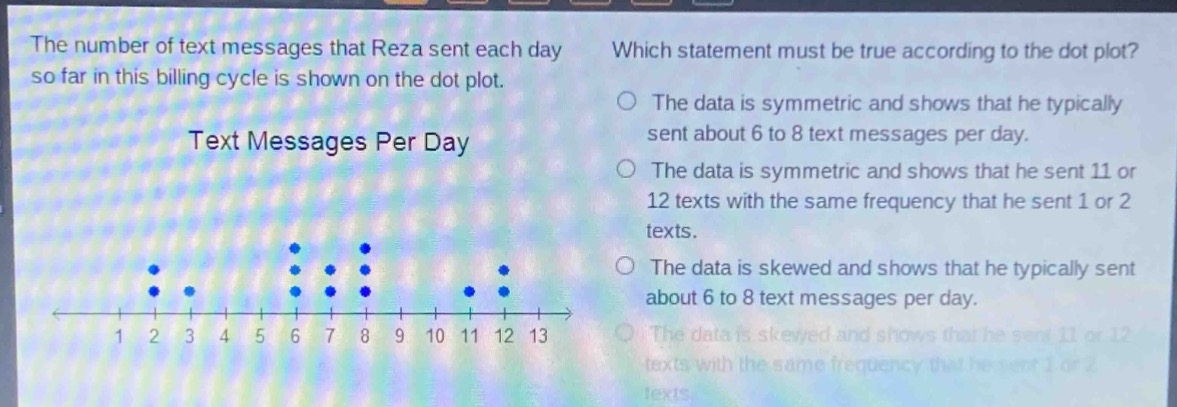
the number of text messages that reza sent each day so far in this billing cycle is shown on the dot plot. text messages per day which statement must be true according to the dot plot? the data is symmetric and shows that he typically sent about 6 to 8 text messages per day. the data is symmetric and shows that he sent 11 or 12 texts with the same frequency that he sent 1 or 2 texts. the data is skewed and shows that he typically sent about 6 to 8 text messages per day. the data is skewed and shows that he sent 11 or 12 texts with the same frequency that he sent 1 or 2 texts.
Answer
Explanation:
Step1: Analyze data symmetry
The data is not symmetric as the left - hand side and right - hand side of the distribution are not mirror images.
Step2: Check for skewness
The data is skewed. There are more data points on the left side (lower number of texts) and fewer on the right side (higher number of texts). Also, most of the data points are clustered around 6 - 8 text messages per day.
Answer:
The data is skewed and shows that he typically sent about 6 to 8 text messages per day.