a nutritionist is studying the relationship between the amount of cholesterol and the number of calories in…
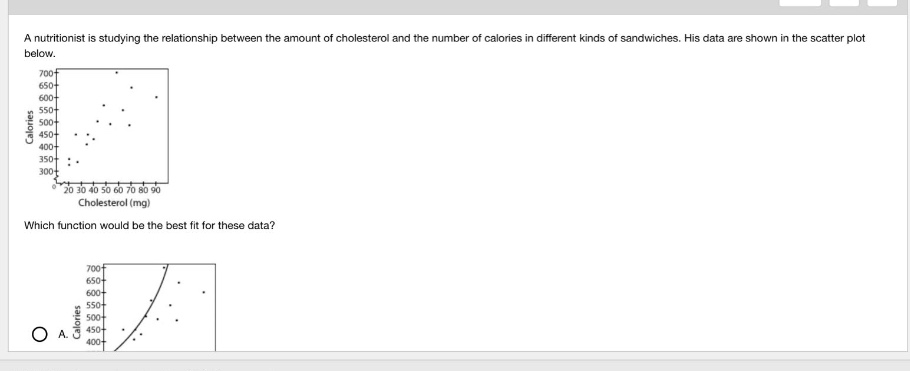
a nutritionist is studying the relationship between the amount of cholesterol and the number of calories in different kinds of sandwiches. his data are shown in the scatter plot below.\nwhich function would be the best fit for these data?
Answer
Explanation:
Step1: Analyze the scatter plot trend
The data points show a positive correlation where calories increase as cholesterol increases.
Step2: Evaluate the pattern of the data
The points are distributed in a roughly straight path, suggesting a constant rate of change.
Step3: Compare linear and non-linear models
A linear function (straight line) passes through the center of the data cluster more effectively than a curve.
Step4: Identify the best fit line
The line should have a positive slope and a y-intercept around 300 to 350 based on the visual trend.
Answer:
A linear function would be the best fit for these data.