oliver analyzes the percentage of 4th - grade students in his school who were proficient on the states math…
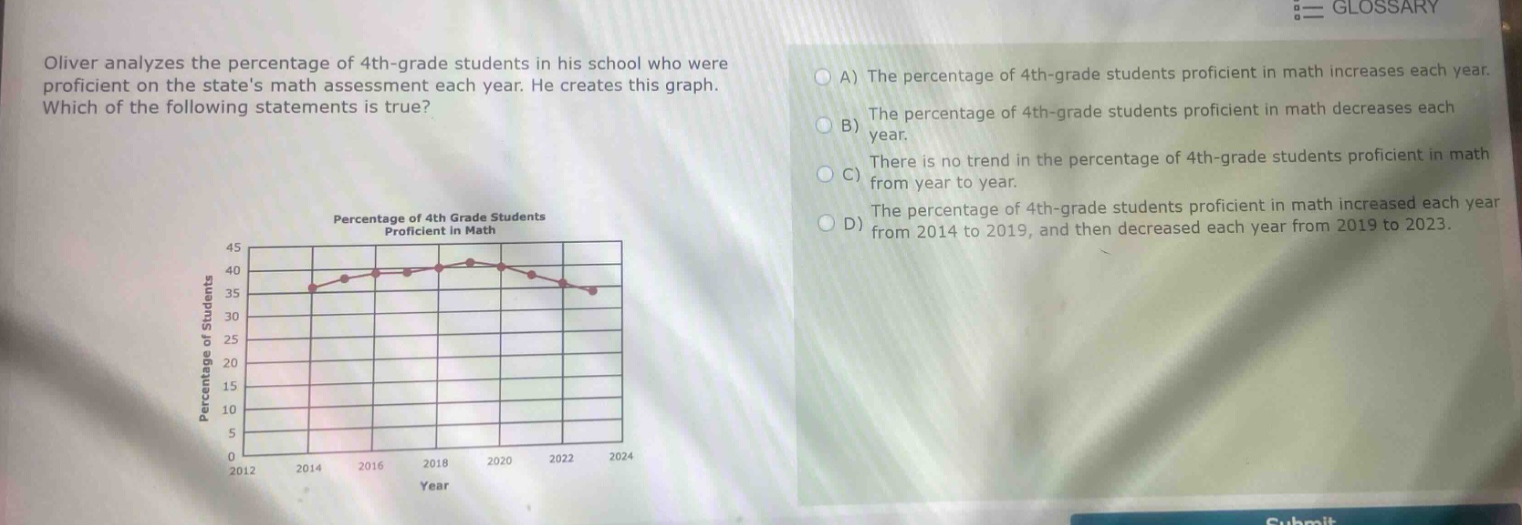
oliver analyzes the percentage of 4th - grade students in his school who were proficient on the states math assessment each year. he creates this graph. which of the following statements is true? a) the percentage of 4th - grade students proficient in math increases each year. b) the percentage of 4th - grade students proficient in math decreases each year. c) there is no trend in the percentage of 4th - grade students proficient in math from year to year. d) the percentage of 4th - grade students proficient in math increased each year from 2014 to 2019, and then decreased each year from 2019 to 2023.
Answer
Answer:
D. The percentage of 4th - grade students proficient in math increased each year from 2014 to 2019, and then decreased each year from 2019 to 2023.
Explanation:
Step1: Observe the graph trend
From 2014 - 2019, points are rising.
Step2: Observe the graph trend
From 2019 - 2023, points are falling.