the owner of a fitness center conducted a survey using 20 people at the center, selected at random. each…
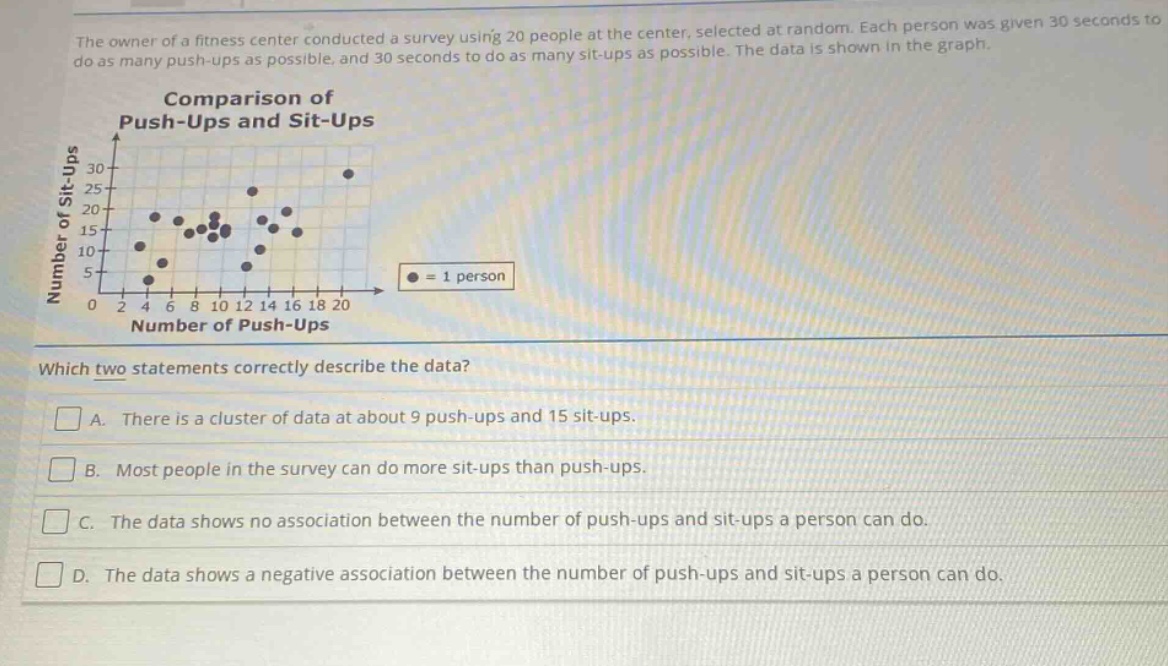
the owner of a fitness center conducted a survey using 20 people at the center, selected at random. each person was given 30 seconds to do as many push - ups as possible, and 30 seconds to do as many sit - ups as possible. the data is shown in the graph. comparison of push - ups and sit - ups which two statements correctly describe the data? a. there is a cluster of data at about 9 push - ups and 15 sit - ups. b. most people in the survey can do more sit - ups than push - ups. c. the data shows no association between the number of push - ups and sit - ups a person can do. d. the data shows a negative association between the number of push - ups and sit - ups a person can do.
Answer
Brief Explanations:
- Analyze the scatter - plot:
- For option A, visually inspect the graph to see if there is a cluster around 9 push - ups and 15 sit - ups. There is indeed a group of data points in that area.
- For option B, compare the number of data points above and below the line (y = x) (where the number of sit - ups equals the number of push - ups). Most points are above this line, meaning most people can do more sit - ups than push - ups.
- For option C, the data points do seem to have some pattern rather than being completely random, so there is an association.
- For option D, the data points do not show a downward - sloping trend (which would indicate a negative association).
Answer:
A. There is a cluster of data at about 9 push - ups and 15 sit - ups. B. Most people in the survey can do more sit - ups than push - ups.