the owner of a fruit stand gathered data for a week about the number of watermelons, pumpkins, and…
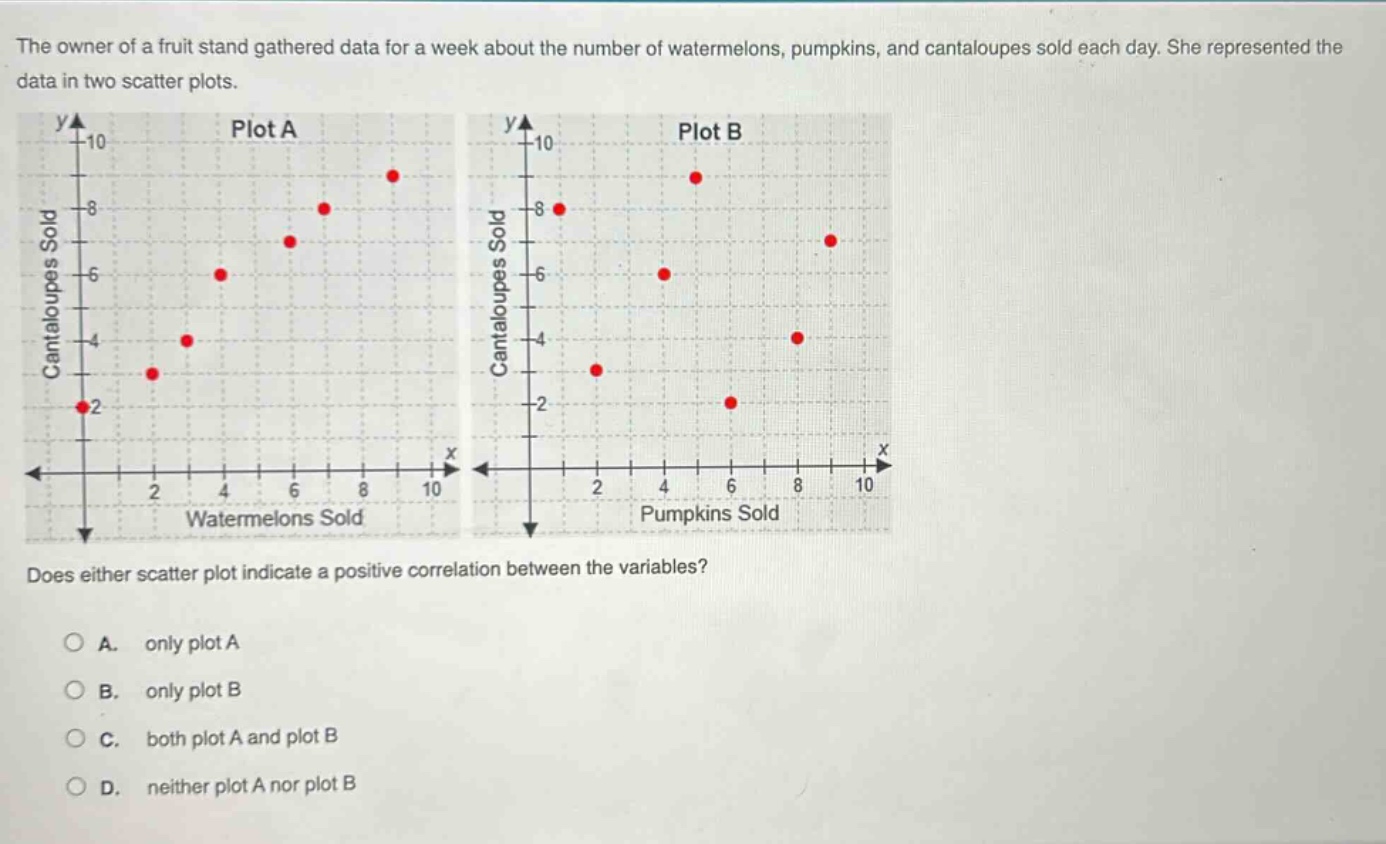
the owner of a fruit stand gathered data for a week about the number of watermelons, pumpkins, and cantaloupes sold each day. she represented the data in two scatter plots. does either scatter plot indicate a positive correlation between the variables? a. only plot a b. only plot b c. both plot a and plot b d. neither plot a nor plot b
Answer
Explanation:
Step1: Check Plot A
As the number of water - melons sold (x - axis) increases, the number of cantaloupes sold (y - axis) also increases. So, Plot A has a positive correlation.
Step2: Check Plot B
As the number of pumpkins sold (x - axis) increases, the number of cantaloupes sold (y - axis) does not show a consistent increasing trend. So, Plot B does not have a positive correlation.
Answer:
A. only plot A