the owners of camis carnival kept track of how many visitors they had each day last summer. this box plot…
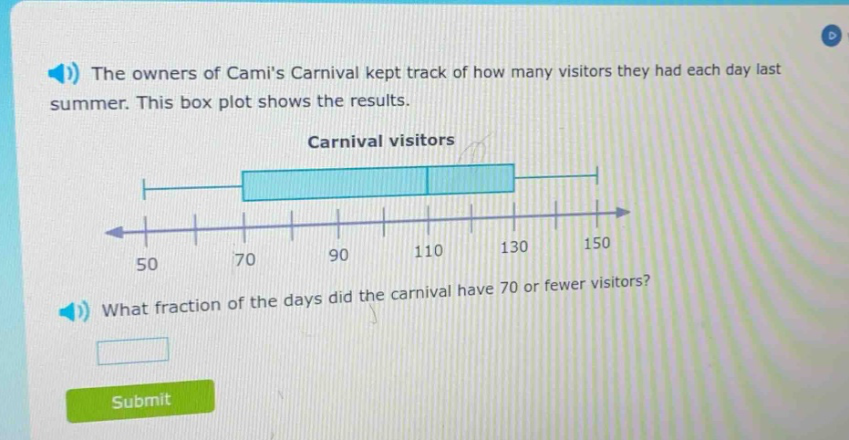
the owners of camis carnival kept track of how many visitors they had each day last summer. this box plot shows the results. carnival visitors what fraction of the days did the carnival have 70 or fewer visitors?
Answer
Explanation:
Step1: Recall box - plot properties
A box - plot divides data into quartiles. The left - most whisker represents the minimum value, the left side of the box represents the first quartile ($Q_1$), the line inside the box represents the median ($Q_2$), the right side of the box represents the third quartile ($Q_3$), and the right - most whisker represents the maximum value.
Step2: Identify quartile values
In a box - plot, the first quartile ($Q_1$) marks the value below which 25% (or $\frac{1}{4}$) of the data lies. Here, 70 is the first quartile value.
Answer:
$\frac{1}{4}$