the parallel boxplots below display the quiz grades (out of 30) for two of mrs. smiths statistics classes…
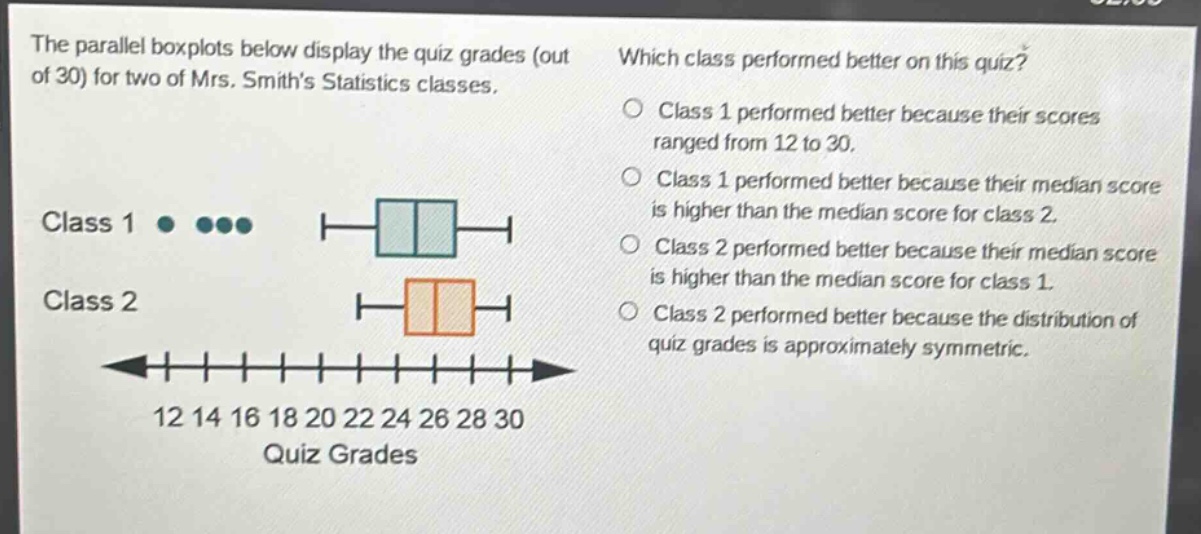
the parallel boxplots below display the quiz grades (out of 30) for two of mrs. smiths statistics classes. which class performed better on this quiz? class 1 performed better because their scores ranged from 12 to 30. class 1 performed better because their median score is higher than the median score for class 2. class 2 performed better because their median score is higher than the median score for class 1. class 2 performed better because the distribution of quiz grades is approximately symmetric. class 1 class 2 quiz grades 12 14 16 18 20 22 24 26 28 30
Answer
Brief Explanations:
In a box - plot, the median is represented by the line inside the box. To determine which class performed better, we compare the medians. A higher median indicates better performance. Class 2's median (line inside its box) is higher than Class 1's median. Symmetry (last option) does not directly relate to better performance. The range (first option) also does not determine better performance as it just shows the spread.
Answer:
Class 2 performed better because their median score is higher than the median score for class 1.