the parallel dotplots below display the number of absences for students in each of two classes. which of the…
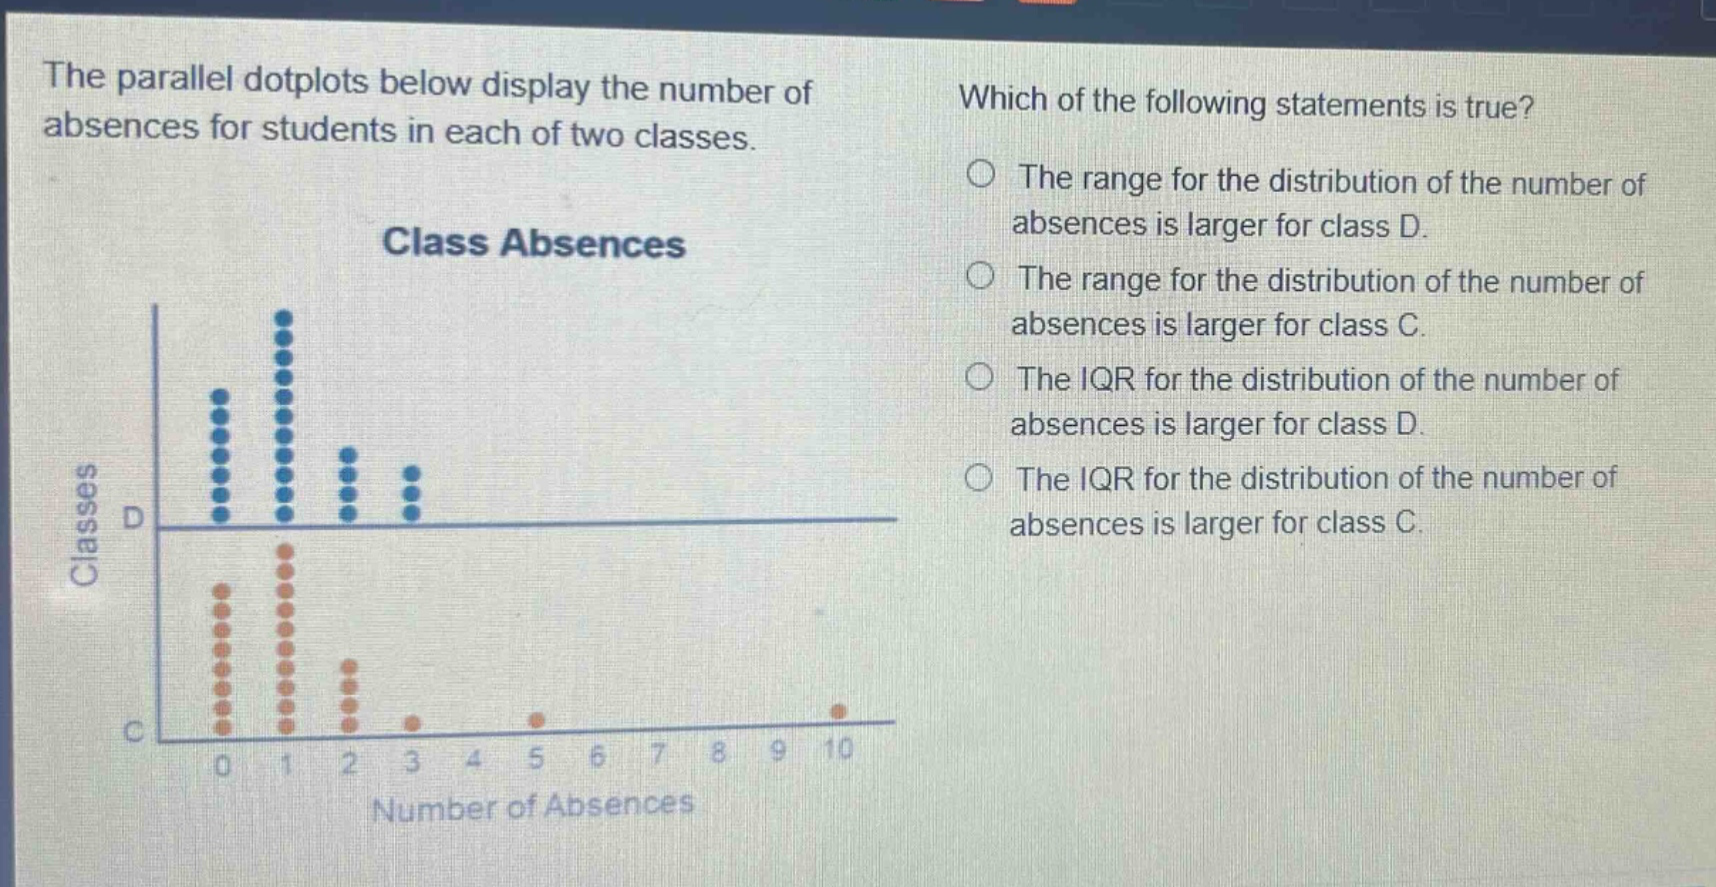
the parallel dotplots below display the number of absences for students in each of two classes. which of the following statements is true? the range for the distribution of the number of absences is larger for class d. the range for the distribution of the number of absences is larger for class c. the iqr for the distribution of the number of absences is larger for class d. the iqr for the distribution of the number of absences is larger for class c.
Answer
Explanation:
Step1: Recall range formula
Range = Maximum - Minimum
Step2: Find range for class D
For class D, maximum = 3, minimum = 0. Range_D = 3 - 0 = 3
Step3: Find range for class C
For class C, maximum = 10, minimum = 0. Range_C = 10 - 0 = 10 Since 10>3, range for class C is larger.
Step4: Recall IQR formula
IQR = Q3 - Q1 (Quartile 3 - Quartile 1) To find quartiles, we need to order data and find median - related values. But just from range comparison we can already see range of C is larger.
Answer:
The range for the distribution of the number of absences is larger for class C.