as part of a survey, a group of people were asked to name their preferred method of viewing television…
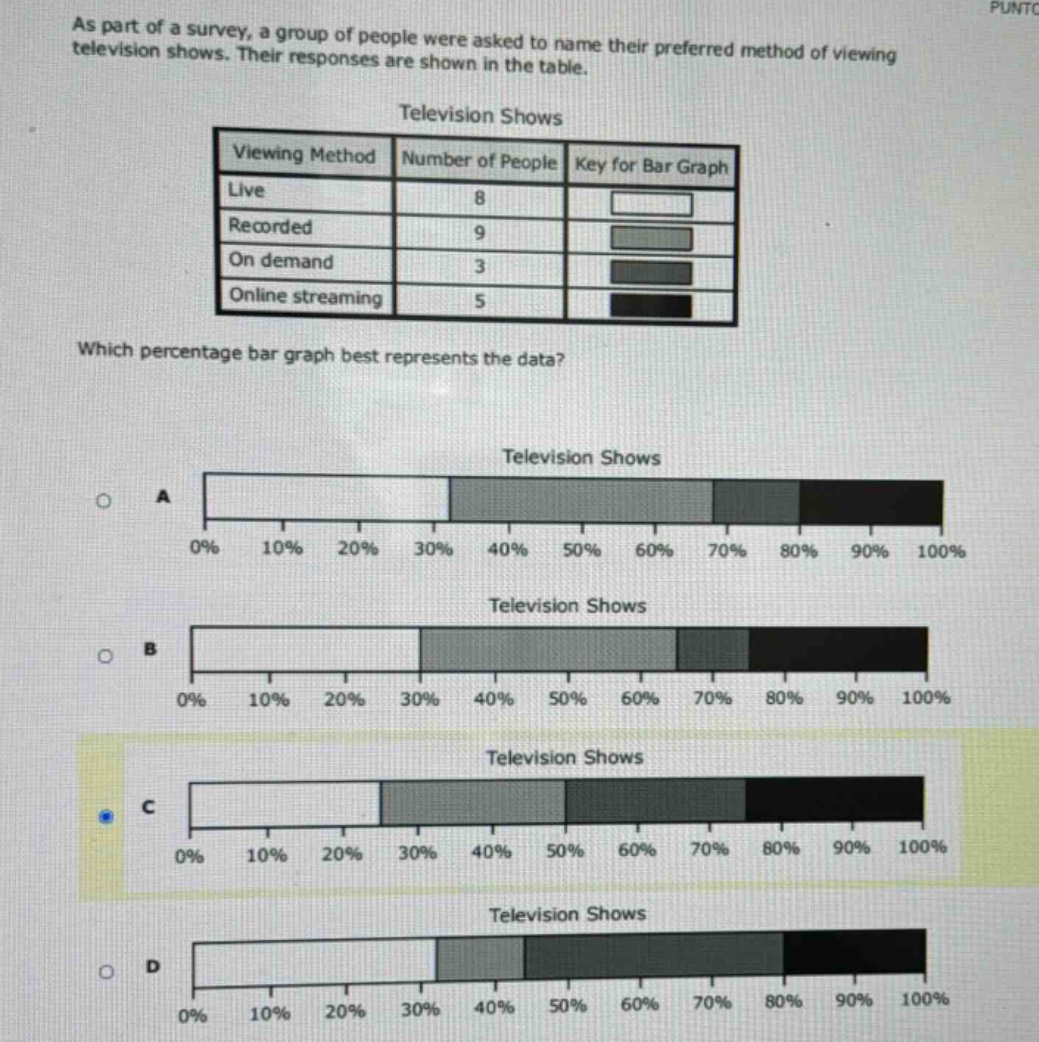
as part of a survey, a group of people were asked to name their preferred method of viewing television shows. their responses are shown in the table.\n\n| viewing method | number of people | key for bar graph |\n| ---- | ---- | ---- |\n| live | 8 | |\n| recorded | 9 | |\n| on demand | 3 | |\n| online streaming | 5 | |\n\nwhich percentage bar graph best represents the data?
Answer
Explanation:
Step1: Calcular el total de personas
$8 + 9+3 + 5=25$
Step2: Calcular el porcentaje para cada método de visualización
Live
$\frac{8}{25}\times100 = 32%$
Recorded
$\frac{9}{25}\times100 = 36%$
On - demand
$\frac{3}{25}\times100 = 12%$
Online streaming
$\frac{5}{25}\times100 = 20%$
Step3: Analizar cada gráfico de barras de porcentajes
- En el gráfico A, los porcentajes no coinciden con los calculados.
- En el gráfico B, los porcentajes no coinciden con los calculados.
- En el gráfico C, los porcentajes ($32%,36%,12%,20%$) coinciden con los calculados para Live, Recorded, On - demand y Online streaming respectivamente.
- En el gráfico D, los porcentajes no coinciden con los calculados.
Answer:
C