at the pascal middle school spring festival, students can use tickets to play a variety of games. the games…
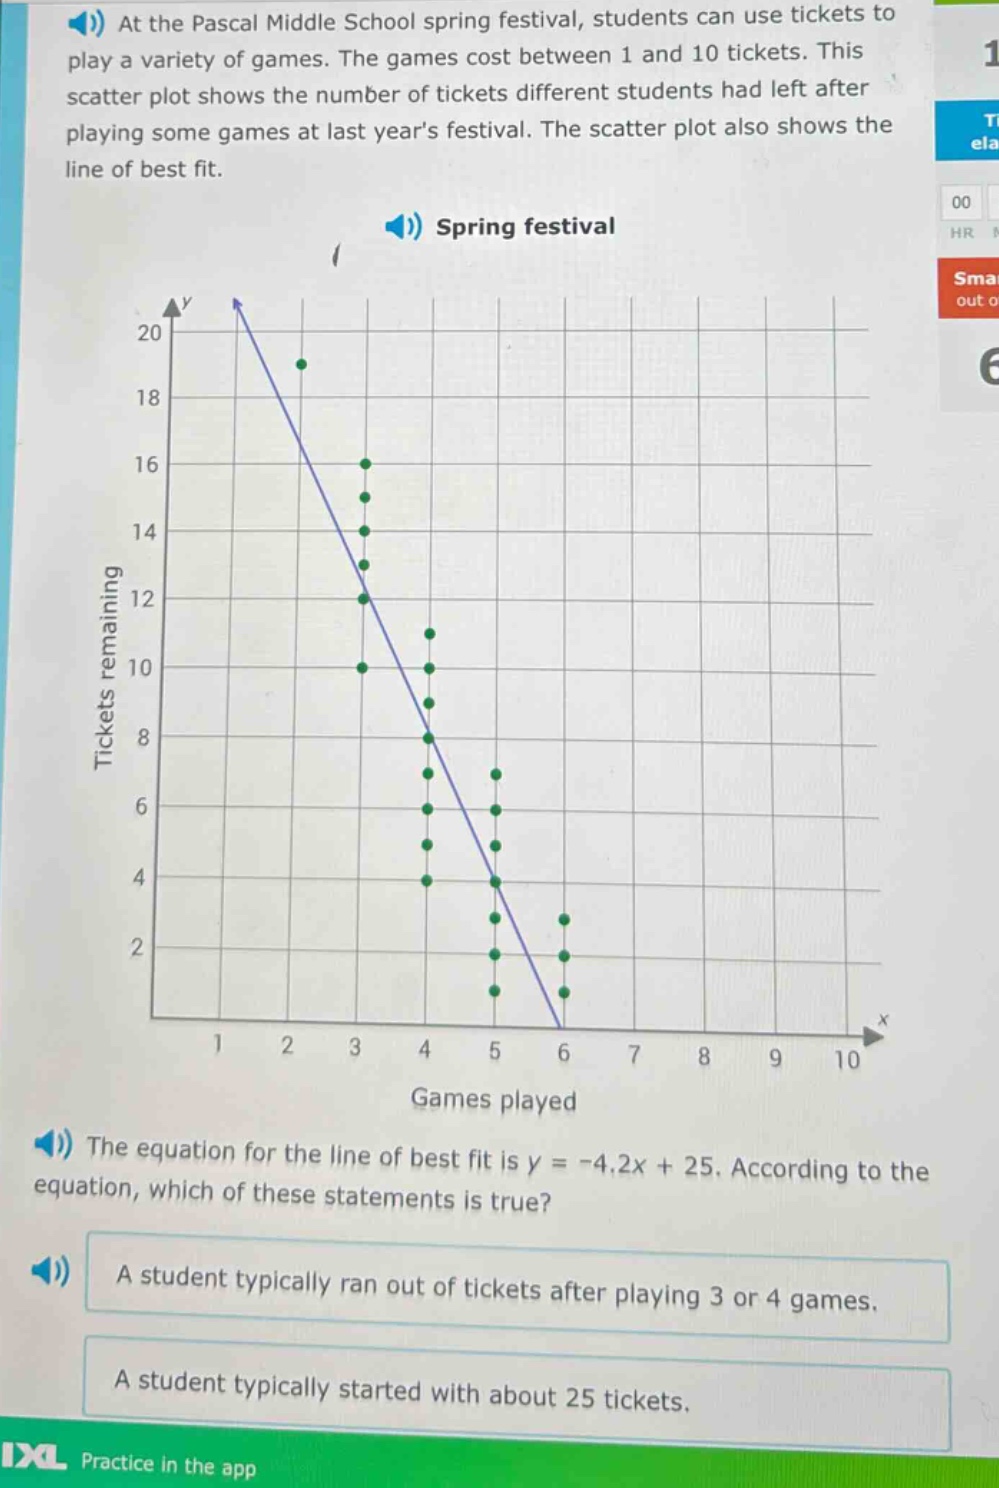
at the pascal middle school spring festival, students can use tickets to play a variety of games. the games cost between 1 and 10 tickets. this scatter plot shows the number of tickets different students had left after playing some games at last years festival. the scatter plot also shows the line of best fit. spring festival the equation for the line of best fit is y = -4.2x + 25. according to the equation, which of these statements is true? a student typically ran out of tickets after playing 3 or 4 games. a student typically started with about 25 tickets.
Answer
Explanation:
Step1: Analyze the line - of - best - fit equation
The equation of the line of best fit is $y=-4.2x + 25$, where $y$ is the number of tickets remaining and $x$ is the number of games played.
Step2: Consider the $y$ - intercept
The $y$ - intercept of the line is the value of $y$ when $x = 0$. When $x=0$, we substitute into the equation: $y=-4.2\times0 + 25=25$. This represents the number of tickets a student started with.
Step3: Consider when a student runs out of tickets
A student runs out of tickets when $y = 0$. We set $y = 0$ in the equation $0=-4.2x + 25$. Then $4.2x=25$, and $x=\frac{25}{4.2}\approx5.95$. So a student runs out of tickets after about 6 games.
Answer:
A student typically started with about 25 tickets.