payton collected data to show the relationship between the number of hours he practices and the number of…
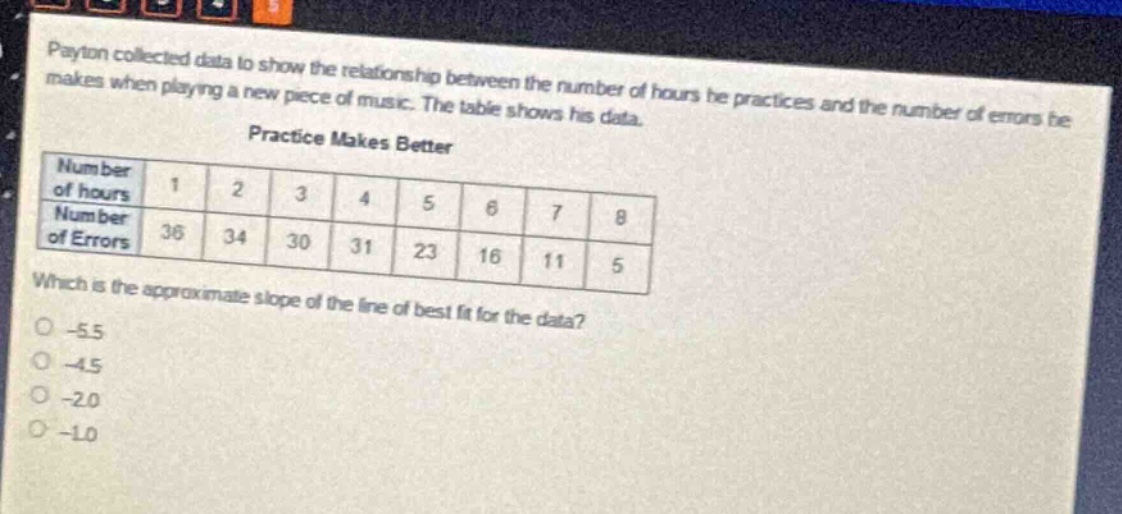
payton collected data to show the relationship between the number of hours he practices and the number of errors he makes when playing a new piece of music. the table shows his data.\npractice makes better\n| number of hours | 1 | 2 | 3 | 4 | 5 | 6 | 7 | 8 |\n| number of errors | 36 | 34 | 30 | 31 | 23 | 16 | 11 | 5 |\nwhich is the approximate slope of the line of best fit for the data?\n- -5.5\n- -4.5\n- -2.0\n- -1.0
Answer
Explanation:
Step1: Recall slope formula
The slope formula for two - points $(x_1,y_1)$ and $(x_2,y_2)$ is $m=\frac{y_2 - y_1}{x_2 - x_1}$. We can also use a more general method for finding the slope of the line of best - fit for a set of data points. We'll use the first and the last points from the data set. Let $x$ be the number of hours and $y$ be the number of errors. The first point is $(1,36)$ and the last point is $(8,5)$.
Step2: Calculate the slope
$m=\frac{y_2 - y_1}{x_2 - x_1}=\frac{5 - 36}{8 - 1}=\frac{- 31}{7}\approx - 4.43\approx - 4.5$
Answer:
-4.5