people of different ages were asked the question \do you listen to audiobooks?\ the frequency table displays…
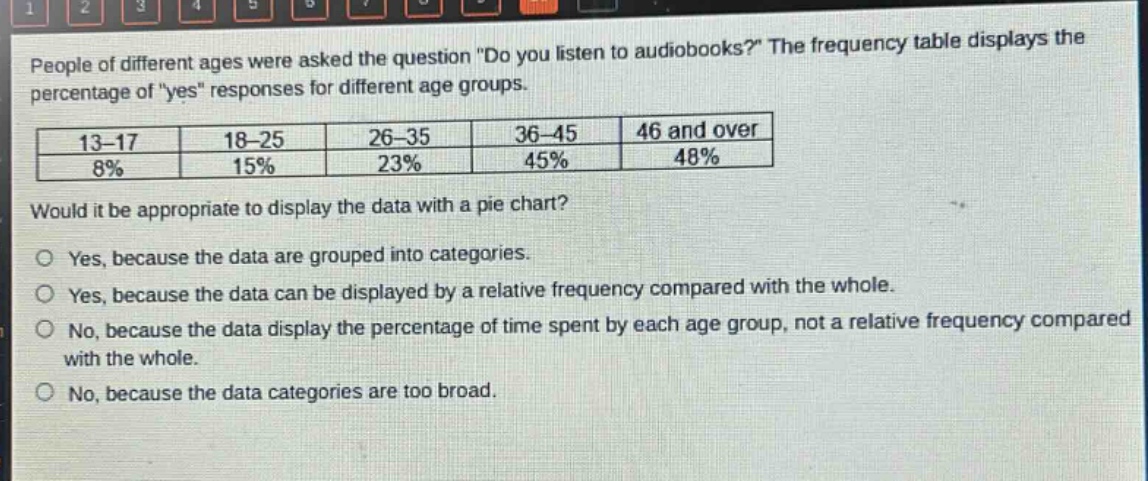
people of different ages were asked the question \do you listen to audiobooks?\ the frequency table displays the percentage of \yes\ responses for different age groups.\n| 13 - 17 | 18 - 25 | 26 - 35 | 36 - 45 | 46 and over |\n| 8% | 15% | 23% | 45% | 48% |\nwould it be appropriate to display the data with a pie chart?\no yes, because the data are grouped into categories.\no yes, because the data can be displayed by a relative frequency compared with the whole.\no no, because the data display the percentage of time spent by each age group, not a relative frequency compared with the whole.\no no, because the data categories are too broad.
Answer
Answer:
No, because the data display the percentage of time spent by each age group, not a relative frequency compared with the whole.
Explanation:
Step1: Understand pie - chart requirements
A pie - chart shows parts of a whole as relative frequencies.
Step2: Analyze given data
The given data are percentages of "yes" responses for age groups, not relative to a single whole. For example, we don't know if these age - groups together make up 100% of all possible age - groups. So, it's not appropriate for a pie - chart.