what percentage of the data values falls between the values of 3 and 24 in the data set shown?\n0 5 10 15 20…
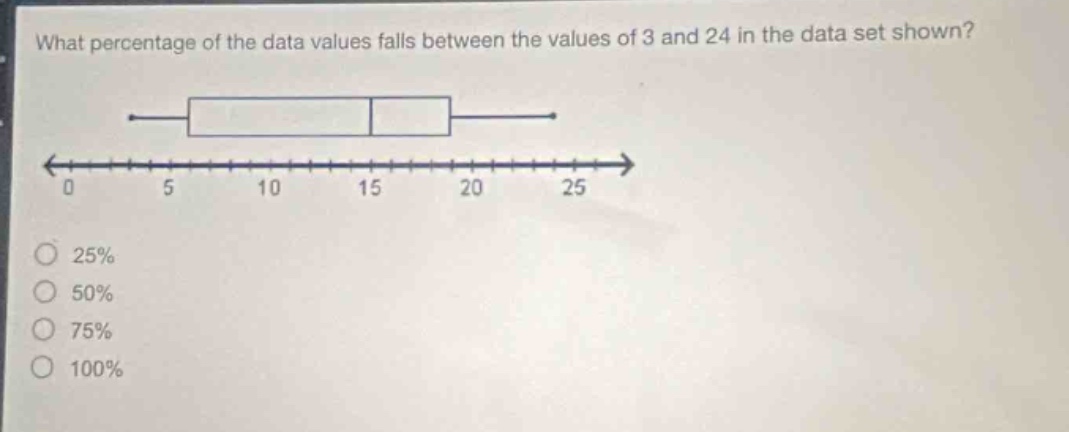
what percentage of the data values falls between the values of 3 and 24 in the data set shown?\n0 5 10 15 20 25\n25%\n50%\n75%\n100%
Answer
Answer:
75%
Explanation:
Step1: Identify quartile values
The box - and - whisker plot has the following characteristics: The left - most value of the box is the first quartile ($Q_1$), the line inside the box is the median ($Q_2$), and the right - most value of the box is the third quartile ($Q_3$). The minimum value is around 0 and the maximum value is around 25. The box starts around 5 and ends around 20.
Step2: Analyze the position of 3 and 24
The value 3 is less than the first quartile value (around 5) and 24 is greater than the third quartile value (around 20). The inter - quartile range (IQR) which is from $Q_1$ to $Q_3$ contains 50% of the data. The data from the minimum to $Q_1$ contains 25% of the data and the data from $Q_3$ to the maximum contains 25% of the data. Since 3 is below $Q_1$ and 24 is above $Q_3$, the percentage of data between 3 and 24 is 25% (from $Q_1$ to $Q_2$)+25% (from $Q_2$ to $Q_3$)+25% (from the value just above $Q_3$ to 24) = 75%.