what percentage of the data values falls between the values of 27 and 45 in the data set shown?\n25 30 35 40…
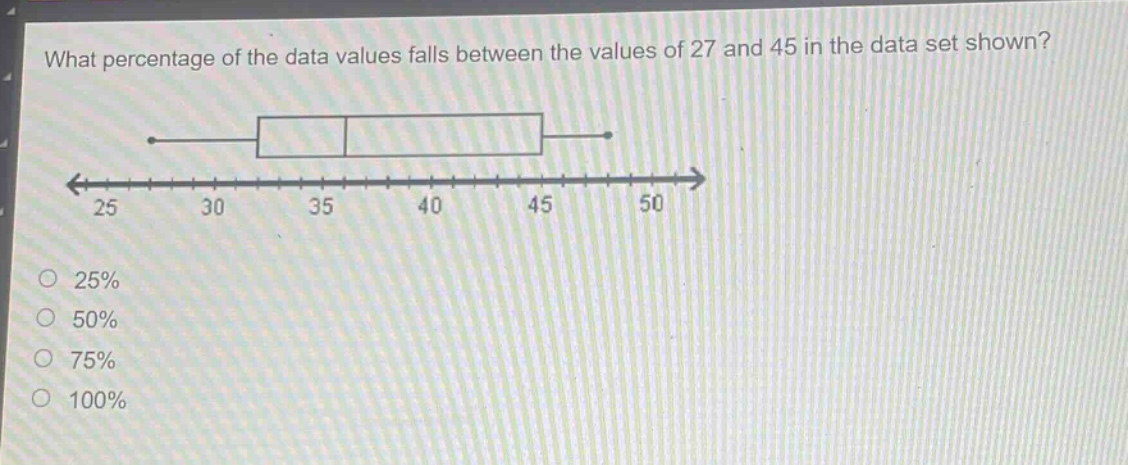
what percentage of the data values falls between the values of 27 and 45 in the data set shown?\n25 30 35 40 45 50\n25%\n50%\n75%\n100%
Answer
Answer:
C. 75%
Explanation:
Step1: Identify quartile values
The box - and - whisker plot shows that the minimum value is 25, the first quartile ($Q_1$) is 30, the median ($Q_2$) is 35, the third quartile ($Q_3$) is 45, and the maximum value is 50.
Step2: Determine position of 27
Since 27 is greater than the minimum value of 25 and less than $Q_1 = 30$, values starting from just above 25 up to 45 cover from the start of the data set up to $Q_3$.
Step3: Calculate percentage
The percentage of data from the start of the data set up to the third - quartile ($Q_3$) is 75%. So the percentage of data values between 27 and 45 is 75%.