what percentage of the data values represented on a box plot falls between the lower quartile and the upper…
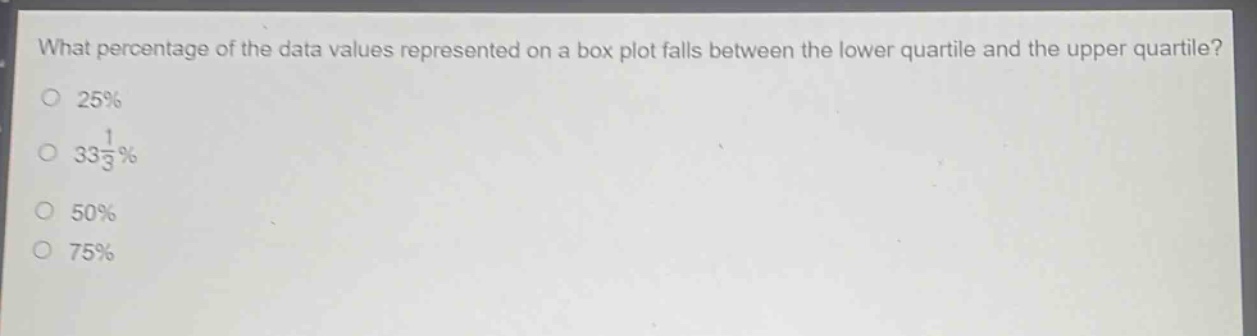
what percentage of the data values represented on a box plot falls between the lower quartile and the upper quartile?\n25%\n33\\frac{1}{3}%\n50%\n75%
Answer
Answer:
C. 50%
Explanation:
Step1: Recall quartile concept
Quartiles divide data into 4 parts.
Step2: Analyze box - plot quartiles
Lower quartile (Q1) is 1st part, upper quartile (Q3) is 3rd part.
Step3: Calculate percentage
The part between Q1 and Q3 is 2 out of 4 parts. So, $\frac{2}{4}\times100% = 50%$.