pete chooses a marble at random from a bag. there is 1 orange marble, 2 red marbles, 1 yellow marble, and 2…
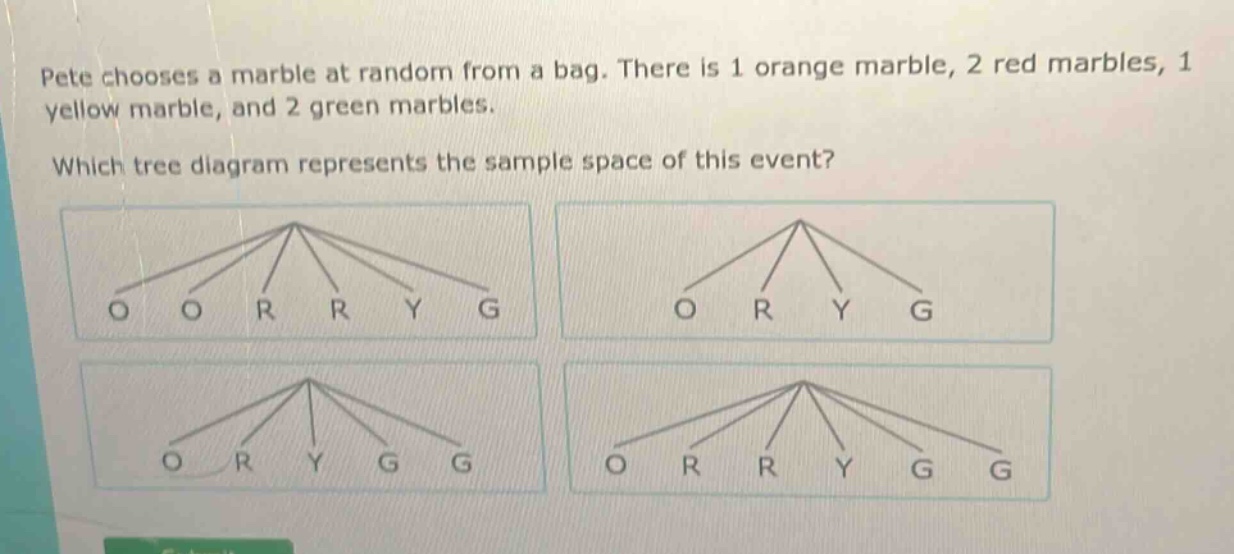
pete chooses a marble at random from a bag. there is 1 orange marble, 2 red marbles, 1 yellow marble, and 2 green marbles. which tree diagram represents the sample space of this event?
Answer
Explanation:
Step1: Count total marbles
There are $1 + 2+1 + 2=6$ marbles in total. The sample - space tree diagram should have branches for each individual marble.
Step2: Analyze marble types and quantities
There is 1 orange (O), 2 red (R), 1 yellow (Y), and 2 green (G) marbles. The tree - diagram should have 1 branch for the orange marble, 2 branches for the red marbles, 1 branch for the yellow marble, and 2 branches for the green marbles.
Answer:
The tree - diagram with branches O, R, R, Y, G, G (the fourth one in the order presented in the image) represents the sample space of this event.