peter went to his schools swim meet to cheer on the team. the scoreboard showed the time of each swimmer in…
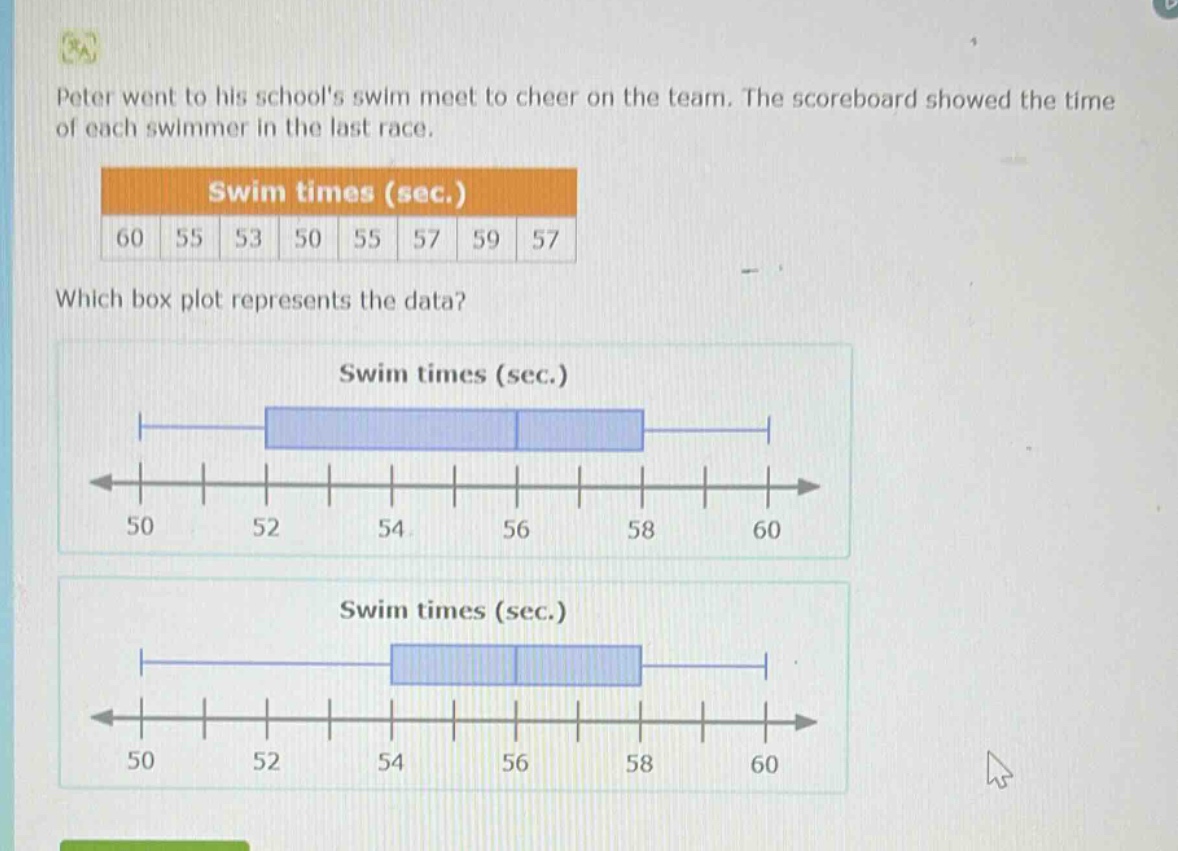
peter went to his schools swim meet to cheer on the team. the scoreboard showed the time of each swimmer in the last race. swim times (sec.) 60 55 53 50 55 57 59 57 which box plot represents the data? swim times (sec.) 50 52 54 56 58 60 swim times (sec.) 50 52 54 56 58 60
Answer
Answer:
We need to find the five - number summary (minimum, first quartile $Q_1$, median, third quartile $Q_3$, maximum) of the data set ${60,55,53,50,55,57,59,57}$ to determine the correct box - plot.
- Arrange the data in ascending order:
- The ordered data set is ${50,53,55,55,57,57,59,60}$.
- Find the minimum and maximum values:
- Minimum: The smallest value in the data set is $50$.
- Maximum: The largest value in the data set is $60$.
- Find the median ($Q_2$):
- Since there are $n = 8$ data points, the median is the average of the $\frac{n}{2}$th and $(\frac{n}{2}+1)$th ordered data points.
- $\frac{n}{2}=4$ and $\frac{n}{2}+1 = 5$. The $4$th value is $55$ and the $5$th value is $57$. So, the median $Q_2=\frac{55 + 57}{2}=56$.
- Find the first quartile ($Q_1$):
- The lower half of the data set is ${50,53,55,55}$. Since there are $n_1=4$ data points in the lower half, the first quartile is the average of the $\frac{n_1}{2}$th and $(\frac{n_1}{2}+1)$th ordered data points in the lower - half.
- $\frac{n_1}{2}=2$ and $\frac{n_1}{2}+1 = 3$. The $2$nd value is $53$ and the $3$rd value is $55$. So, $Q_1=\frac{53+55}{2}=54$.
- Find the third quartile ($Q_3$):
- The upper half of the data set is ${57,57,59,60}$. Since there are $n_2 = 4$ data points in the upper half, the third quartile is the average of the $\frac{n_2}{2}$th and $(\frac{n_2}{2}+1)$th ordered data points in the upper - half.
- $\frac{n_2}{2}=2$ and $\frac{n_2}{2}+1 = 3$. The $2$nd value is $57$ and the $3$rd value is $59$. So, $Q_3=\frac{57 + 59}{2}=58$.
The box - plot should have a minimum at $50$, $Q_1$ at $54$, median at $56$, $Q_3$ at $58$, and maximum at $60$.
The correct box - plot is the one where the left - most whisker starts at $50$, the left side of the box is at $54$, the line inside the box is at $56$, the right side of the box is at $58$, and the right - most whisker ends at $60$. Without seeing the full options clearly, but based on the five - number summary, we can identify the correct one among them.
Explanation:
Step1: Order the data
${50,53,55,55,57,57,59,60}$
Step2: Find minimum and maximum
Minimum = $50$, Maximum = $60$
Step3: Calculate median
$Q_2=\frac{55 + 57}{2}=56$
Step4: Calculate first quartile
$Q_1=\frac{53+55}{2}=54$
Step5: Calculate third quartile
$Q_3=\frac{57 + 59}{2}=58$