peters pizza place serves thin crust pizza and deep dish pizza. peter, the owner, tracked the number of each…
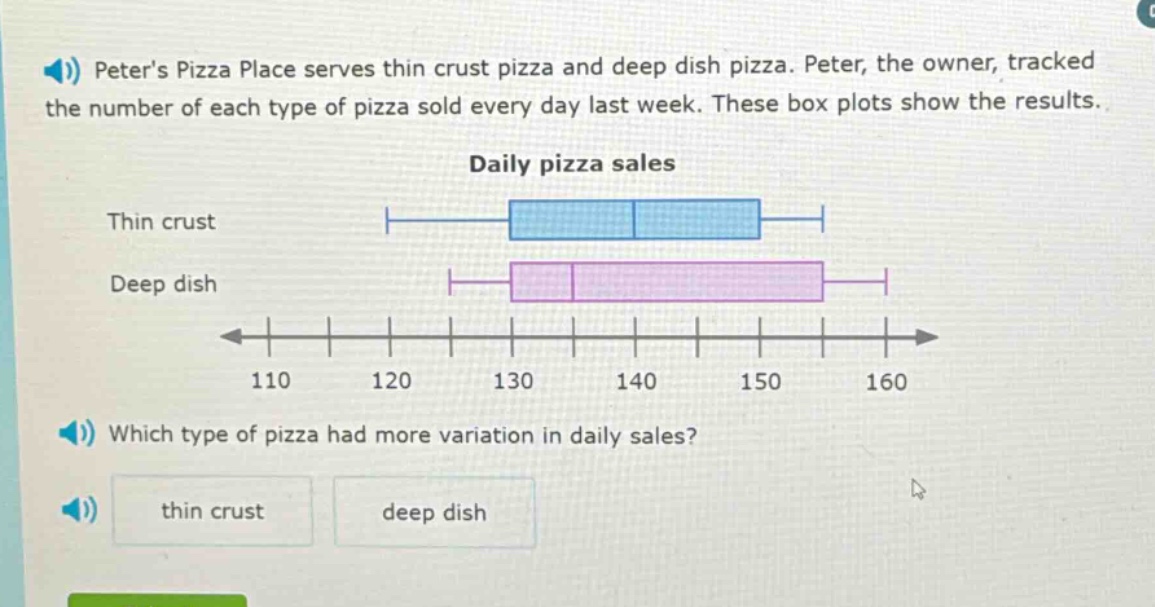
peters pizza place serves thin crust pizza and deep dish pizza. peter, the owner, tracked the number of each type of pizza sold every day last week. these box plots show the results. daily pizza sales thin crust deep dish which type of pizza had more variation in daily sales? thin crust deep dish
Answer
Explanation:
Step1: Recall box - plot spread measure
The spread of data in a box - plot can be measured by the inter - quartile range (IQR) or the range. A larger spread indicates more variation. The length of the box (IQR) or the length from the minimum to the maximum value (range) can be used to compare.
Step2: Observe box - plot lengths
For the thin crust pizza box - plot, the box and the whiskers cover a smaller range of values on the number line compared to the deep dish pizza box - plot. The deep dish pizza box - plot has a longer box and whiskers, which means it has a larger spread of data.
Answer:
deep dish