the picture graph below displays the number of miles for each leg of a triathlon, in which the participants…
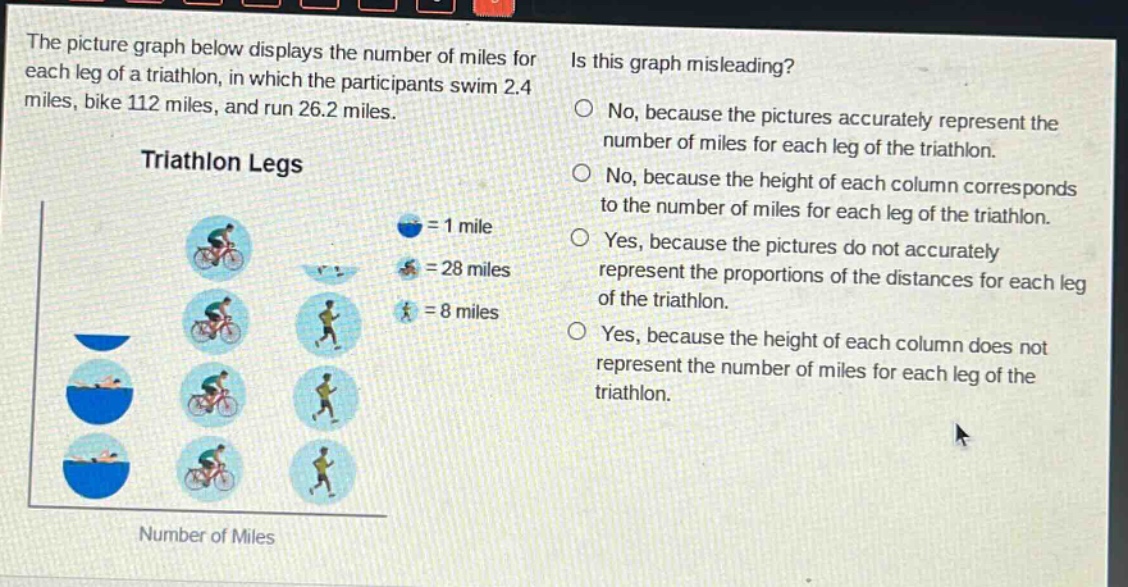
the picture graph below displays the number of miles for each leg of a triathlon, in which the participants swim 2.4 miles, bike 112 miles, and run 26.2 miles. triathlon legs = 1 mile = 28 miles = 8 miles is this graph misleading? no, because the pictures accurately represent the number of miles for each leg of the triathlon. no, because the height of each column corresponds to the number of miles for each leg of the triathlon. yes, because the pictures do not accurately represent the proportions of the distances for each leg of the triathlon. yes, because the height of each column does not represent the number of miles for each leg of the triathlon. number of miles
Answer
Explanation:
Step1: Analyze picture - unit relationship
The swim distance is 2.4 miles, bike is 112 miles and run is 26.2 miles. The picture - unit relationships are: 1 blue - circle = 1 mile, 1 cyclist = 28 miles, 1 runner = 8 miles.
Step2: Check proportion accuracy
The pictures do not accurately represent the proportions of the distances. For example, the bike distance of 112 miles is represented by 4 cyclist pictures. But visually, the relative sizes of the pictures do not give a correct sense of the large differences in the distances.
Answer:
Yes, because the pictures do not accurately represent the proportions of the distances for each leg of the triathlon.