plot a\n0 1 2 3 4 5 6 7 8 9 10\nplot b\n0 1 2 3 4 5 6 7 8 9 10\nwhich statement correctly compares the…
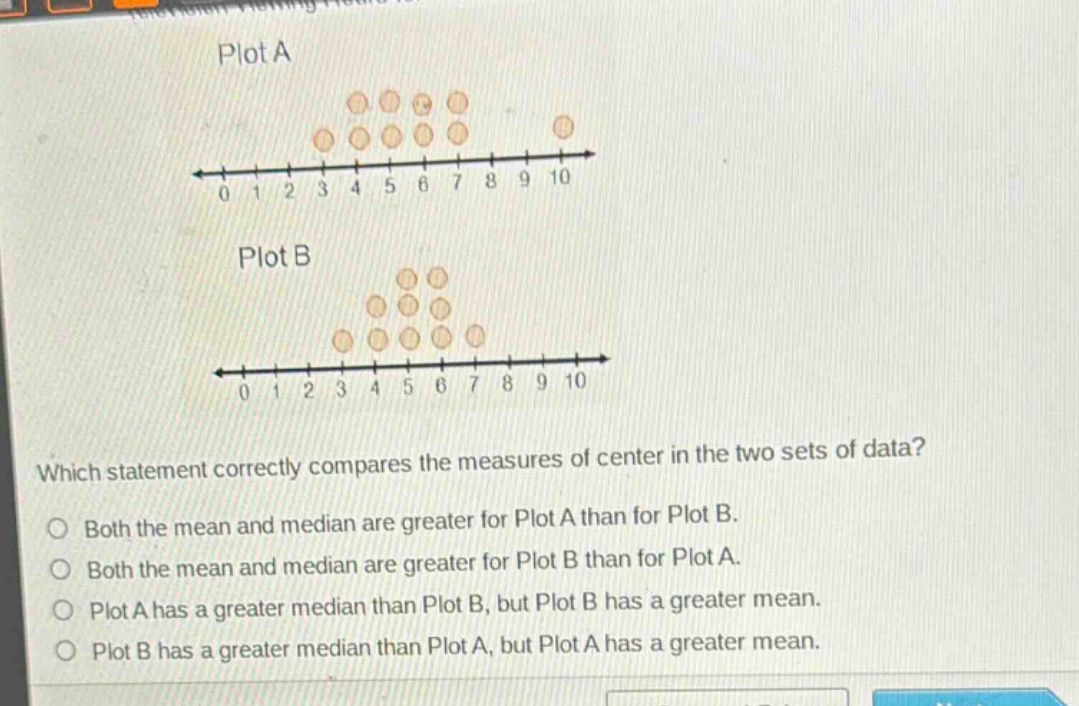
plot a\n0 1 2 3 4 5 6 7 8 9 10\nplot b\n0 1 2 3 4 5 6 7 8 9 10\nwhich statement correctly compares the measures of center in the two sets of data?\nboth the mean and median are greater for plot a than for plot b.\nboth the mean and median are greater for plot b than for plot a.\nplot a has a greater median than plot b, but plot b has a greater mean.\nplot b has a greater median than plot a, but plot a has a greater mean.
Answer
Explanation:
Step1: Count data - points for Plot A
Plot A has 1 + 2+ 5+ 4+ 1 = 13 data - points. The median is the 7th ordered data - point. Counting from the left, the median of Plot A is 6.
Step2: Calculate the mean of Plot A
[ \begin{align*} \text{Mean}_A&=\frac{3\times1 + 4\times2+5\times5 + 6\times4+9\times1}{13}\ &=\frac{3 + 8+25 + 24+9}{13}\ &=\frac{69}{13}\approx5.31 \end{align*} ]
Step3: Count data - points for Plot B
Plot B has 2+ 3+ 5+ 3+ 2 = 15 data - points. The median is the 8th ordered data - point. Counting from the left, the median of Plot B is 5.
Step4: Calculate the mean of Plot B
[ \begin{align*} \text{Mean}_B&=\frac{4\times2+5\times3 + 6\times5+7\times3+8\times2}{15}\ &=\frac{8 + 15+30 + 21+16}{15}\ &=\frac{90}{15}=6 \end{align*} ]
Step5: Compare mean and median
The median of Plot A is 6 and of Plot B is 5. The mean of Plot A is approximately 5.31 and of Plot B is 6. So Plot A has a greater median than Plot B, but Plot B has a greater mean.