plot a point for the minimum, maximum, median, lower quartile, and upper quartile to create the box plot…
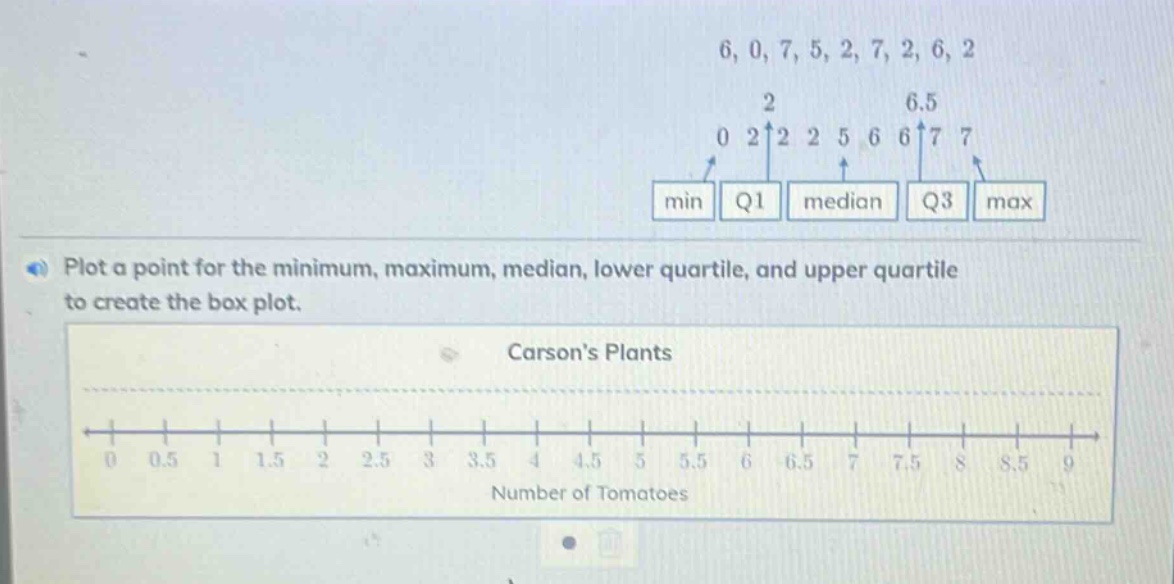
plot a point for the minimum, maximum, median, lower quartile, and upper quartile to create the box plot. carsons plants number of tomatoes
Answer
Explanation:
Step1: Identify values from given data
The minimum value is 0, the maximum value is 7. The median is 5, the lower - quartile (Q1) is 2, and the upper - quartile (Q3) is 6.5.
Step2: Plot points on the number line
On the number line labeled "Number of Tomatoes", plot a point at 0 for the minimum, at 7 for the maximum, at 5 for the median, at 2 for Q1, and at 6.5 for Q3.
Answer:
Plot points at 0 (minimum), 2 (Q1), 5 (median), 6.5 (Q3), 7 (maximum) on the given number line.