points scored per game\nhow can the graph be adjusted to show the skew?\nthe intervals on the x - axis can…
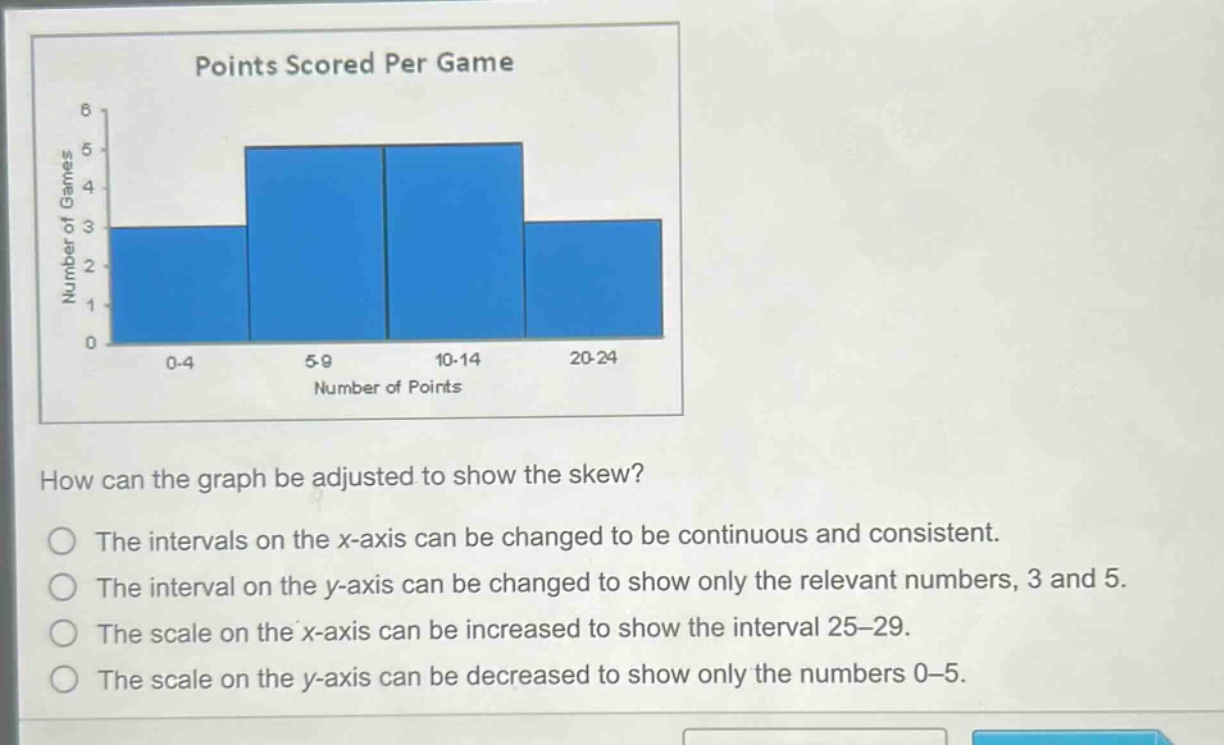
points scored per game\nhow can the graph be adjusted to show the skew?\nthe intervals on the x - axis can be changed to be continuous and consistent.\nthe interval on the y - axis can be changed to show only the relevant numbers, 3 and 5.\nthe scale on the x - axis can be increased to show the interval 25 - 29.\nthe scale on the y - axis can be decreased to show only the numbers 0 - 5.
Answer
Brief Explanations:
To show the skew of a distribution in a bar - chart or histogram, the intervals on the x - axis should be continuous and consistent. In the given graph, the x - axis intervals have a gap (15 - 19 is missing), which can distort the view of the skew. Changing the y - axis scale or values does not help in showing the skew. Adding a new interval (25 - 29) without making the existing intervals continuous also does not address the skew issue.
Answer:
The intervals on the x - axis can be changed to be continuous and consistent.