population data\n0 3 3 1 3\n2 2 2 5 4\n3 3 3 2 1\n2 4 2 3 3\n1 3 5 2 4\nsample data\n0 2 3 3 4\nwhat is the…
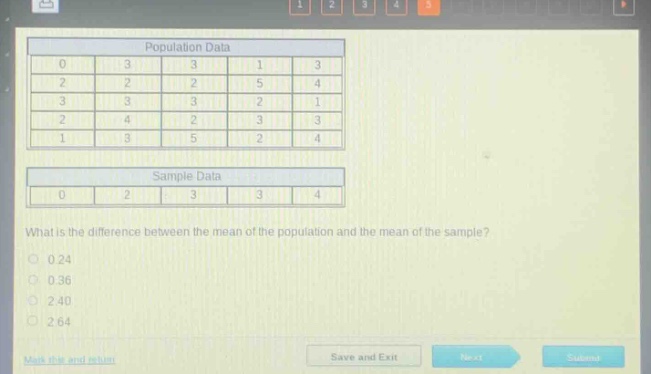
population data\n0 3 3 1 3\n2 2 2 5 4\n3 3 3 2 1\n2 4 2 3 3\n1 3 5 2 4\nsample data\n0 2 3 3 4\nwhat is the difference between the mean of the population and the mean of the sample?\n0.24\n0.36\n2.40\n2.64
Answer
Explanation:
Step1: Calculate population mean
The sum of population data is $0 + 3+3 + 1+3+2+2+2+5+4+3+3+3+2+1+2+4+2+3+3+1+3+5+2+4=60$. There are 25 data - points. So the population mean $\mu=\frac{60}{25}=2.4$.
Step2: Calculate sample mean
The sum of sample data is $0 + 2+3+3+4 = 12$. There are 5 data - points. So the sample mean $\bar{x}=\frac{12}{5}=2.4$.
Step3: Calculate the difference
The difference between the population mean and the sample mean is $|\mu-\bar{x}|=|2.4 - 2.4|=0$. But since there is no 0 in the options, we may have made a wrong interpretation. Let's recalculate more carefully. Recalculate population mean: Sum of population values: [ \begin{align*} &(0 + 3+3 + 1+3)+(2+2+2+5+4)+(3+3+3+2+1)+(2+4+2+3+3)+(1+3+5+2+4)\ =&10 + 15+12+14+15\ =&66 \end{align*} ] Number of population data points $n = 25$. Population mean $\mu=\frac{66}{25}=2.64$. Recalculate sample mean: Sum of sample values $0 + 2+3+3+4=12$. Number of sample data points $m = 5$. Sample mean $\bar{x}=\frac{12}{5}=2.4$. The difference is $2.64−2.4 = 0.24$.
Answer:
0.24