pounds of food collected\n0 | 5 6\n1 | 0 2 3 3 4\n2 | 1 9\n3\n4 | 2\n5 | 1\ninterquartile range\nmedian\nmean…
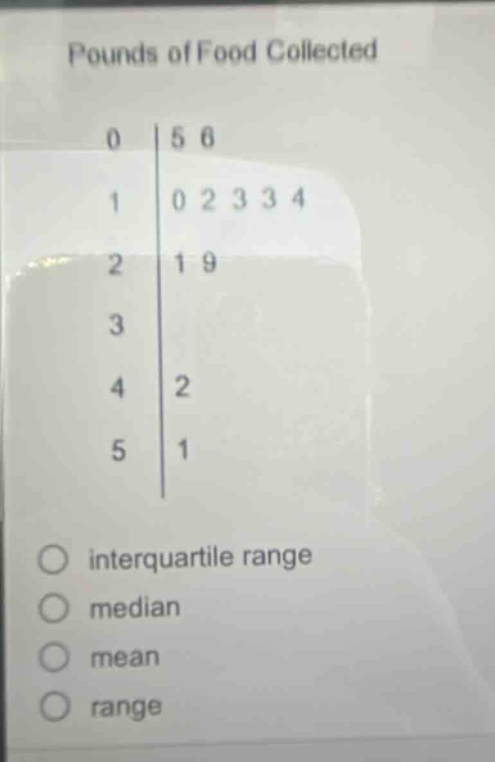
pounds of food collected\n0 | 5 6\n1 | 0 2 3 3 4\n2 | 1 9\n3\n4 | 2\n5 | 1\ninterquartile range\nmedian\nmean\nrange
Answer
- First, write out the data - set from the stem - and - leaf plot:
- The data set is (5,6,10,12,13,13,14,21,29,42,51). There are (n = 11) data points.
- Calculate the median:
- Since (n = 11) (an odd - numbered data set), the median is the (\left(\frac{n + 1}{2}\right))th value.
- (\frac{n+1}{2}=\frac{11 + 1}{2}=6)th value.
- Arranging the data in ascending order: (5,6,10,12,13,13,14,21,29,42,51), the median is (13).
- Calculate the mean:
- The mean (\bar{x}=\frac{\sum_{i = 1}^{n}x_{i}}{n}).
- (\sum_{i=1}^{11}x_{i}=5 + 6+10+12+13+13+14+21+29+42+51=216).
- (\bar{x}=\frac{216}{11}\approx19.64).
- Calculate the range:
- The range is the difference between the maximum and minimum values.
- The maximum value is (51) and the minimum value is (5).
- Range (=51 - 5=46).
- Calculate the inter - quartile range (IQR):
- First, find the lower half and upper half of the data.
- The lower half of the data (excluding the median) is (5,6,10,12,13). The median of the lower half ((Q_1)) is the (\left(\frac{5 + 1}{2}\right)=3)rd value, so (Q_1 = 10).
- The upper half of the data (excluding the median) is (14,21,29,42,51). The median of the upper half ((Q_3)) is the (\left(\frac{5+1}{2}\right)=3)rd value of the upper - half data, so (Q_3 = 29).
- The inter - quartile range (IQR=Q_3 - Q_1=29 - 10 = 19).
Since the question seems to be asking about a measure of spread or central tendency for the given data set from the stem - and - leaf plot, and we have calculated all the given measures:
Explanation:
Step1: Write out data set
(5,6,10,12,13,13,14,21,29,42,51)
Step2: Calculate median
(n = 11), (\text{Median}=13)
Step3: Calculate mean
(\bar{x}=\frac{5 + 6+10+12+13+13+14+21+29+42+51}{11}\approx19.64)
Step4: Calculate range
(\text{Range}=51 - 5 = 46)
Step5: Calculate inter - quartile range
(Q_1 = 10), (Q_3 = 29), (IQR=29 - 10=19)
Answer:
We have calculated the inter - quartile range ((19)), median ((13)), mean ((\approx19.64)), and range ((46)). Since no specific question about which one to choose is asked, if we assume we need to just calculate all of them as per the options given, we have completed the calculations for each measure. If we assume we need to identify which measure is being asked for without further context, we have calculated all the measures listed in the options.