practice analyzing data to create and interpret box plots. the data set below represents the total number of…
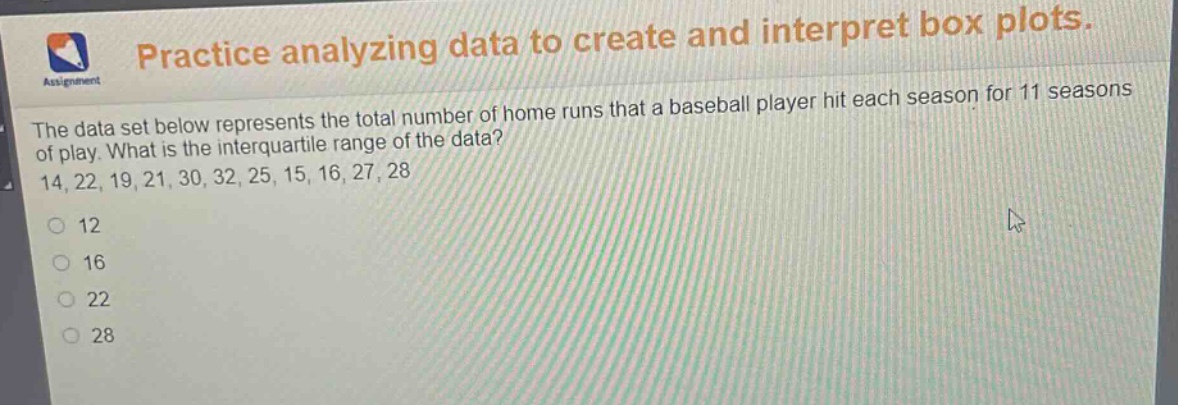
practice analyzing data to create and interpret box plots. the data set below represents the total number of home runs that a baseball player hit each season for 11 seasons of play. what is the interquartile range of the data? 14, 22, 19, 21, 30, 32, 25, 15, 16, 27, 28\n12\n16\n22\n28
Answer
Explanation:
Step1: Sort the data set
$14,15,16,19,21,22,25,27,28,30,32$
Step2: Find the median (Q2)
Since there are 11 data - points, the median is the 6th value. So, $Q2 = 22$.
Step3: Find the lower half and Q1
The lower half is $14,15,16,19,21$. The median of the lower half (Q1) is the 3rd value, so $Q1 = 16$.
Step4: Find the upper half and Q3
The upper half is $25,27,28,30,32$. The median of the upper half (Q3) is the 3rd value of this half, so $Q3 = 28$.
Step5: Calculate the inter - quartile range (IQR)
$IQR=Q3 - Q1=28 - 16 = 12$
Answer:
12