practice describing data in dot plots.\nclass size\nhow can lakota describe the data on the dot…
practice describing data in dot plots.\nclass size\nhow can lakota describe the data on the dot plot?\nchoose all that apply.\nspread\ngap\npeak\ncolor\nsize of dots\ncluster
Answer
Explanation:
Step1: Identify statistical distribution descriptors
Statistical data in dot plots are described by their shape, center, and variability.
Step2: Evaluate "spread"
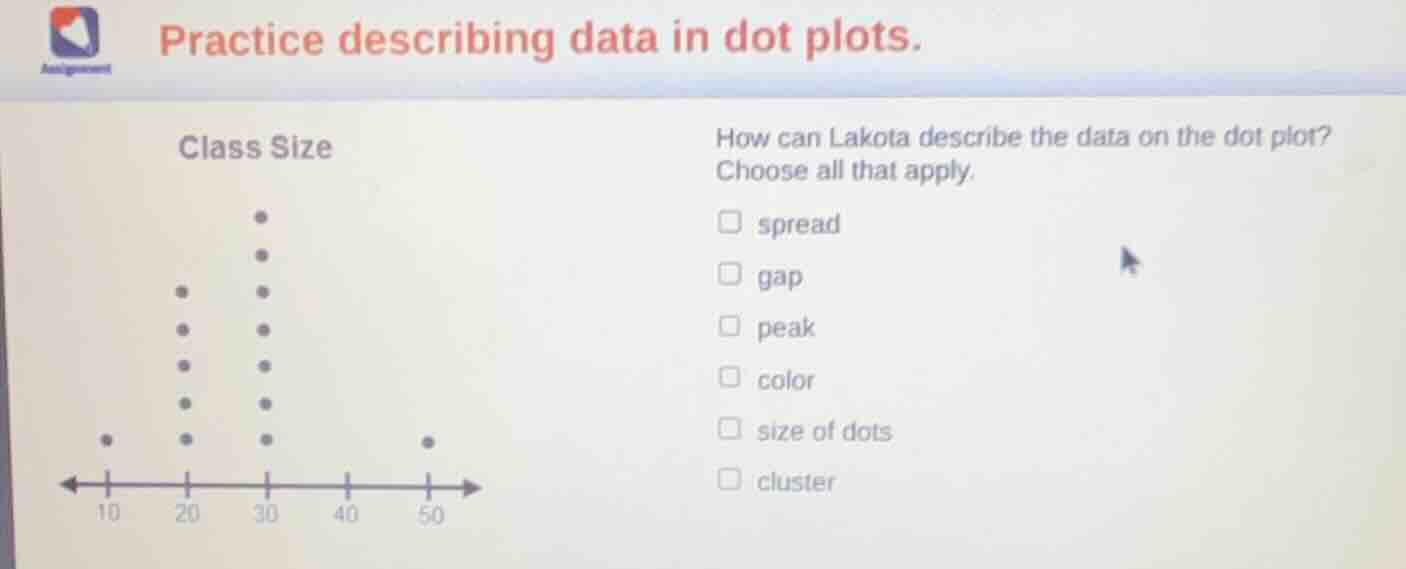
Spread refers to the range or variability of the data (from 10 to 50). $$Range = 50 - 10 = 40$$
Step3: Evaluate "gap"
A gap is an empty space between data points, visible between 30 and 50.
Step4: Evaluate "peak"
A peak is the most frequent value (mode), which is 30 in this plot.
Step5: Evaluate "cluster"
A cluster is a group of data points close together, seen between 10 and 30.
Step6: Exclude non-statistical attributes
Color and size of dots are aesthetic choices, not data characteristics.
Answer:
spread, gap, peak, cluster