practice describing trends in data. which scatter - plot shows no correlation?
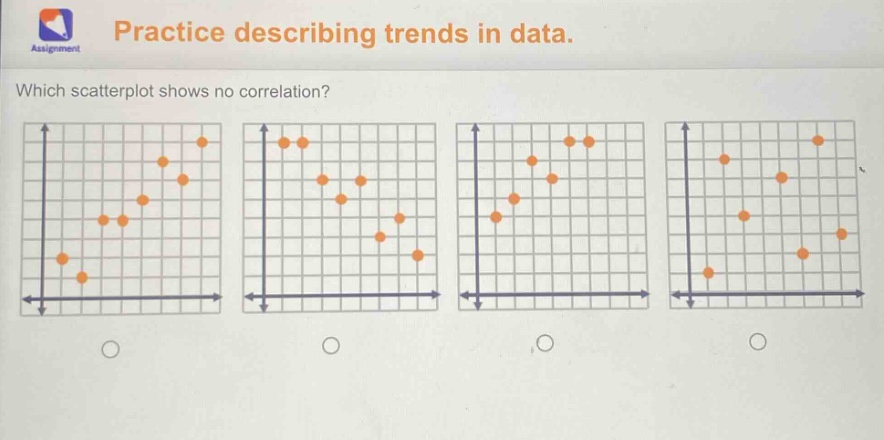
practice describing trends in data. which scatter - plot shows no correlation?
Answer
Answer:
The scatter - plot where the points are randomly scattered with no discernible pattern (usually the last one in a typical set of such plots where others show upward or downward trends). Without specific labels for the plots, it's hard to give a letter - based answer, but conceptually, the one with points that don't seem to follow any linear or non - linear trend.
Explanation:
Step1: Understand correlation
Correlation implies a relationship between two variables. In scatter - plots, a positive correlation shows points trending upwards from left to right, a negative correlation shows points trending downwards from left to right.
Step2: Analyze scatter - plots
Examine each plot for trends. A scatter - plot with no correlation has points that are randomly distributed and do not form any upward or downward slant.