practice modeling real - world scenarios using linear, quadratic, or exponential regressions. which type of…
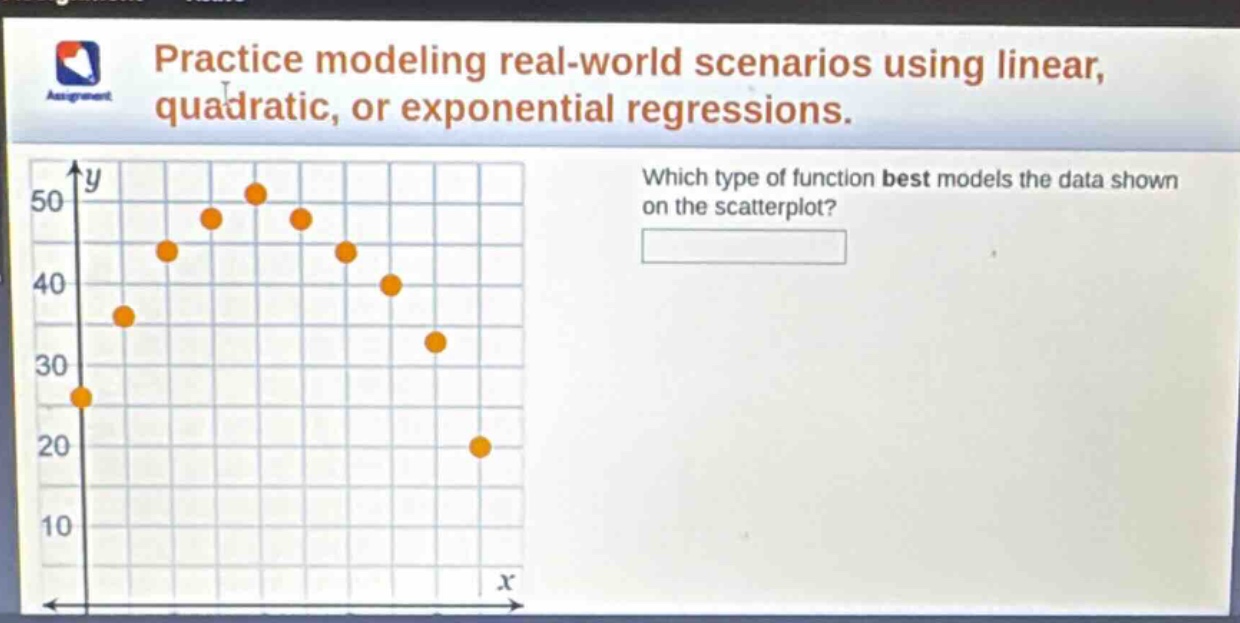
practice modeling real - world scenarios using linear, quadratic, or exponential regressions. which type of function best models the data shown on the scatterplot?
Answer
Explanation:
Step1: Observe the scatter - plot shape
The data points seem to form a curve that opens downwards. A linear function would form a straight - line, an exponential function would show a rapid increase or decrease. A quadratic function (y = ax^{2}+bx + c) can have a parabolic shape. Since the data has a curved pattern that is symmetric (resembling a parabola opening downwards), it is likely a quadratic function.
Answer:
Quadratic function