to prepare for their science test, ms. browns class played a quiz game on the computer in groups. the…
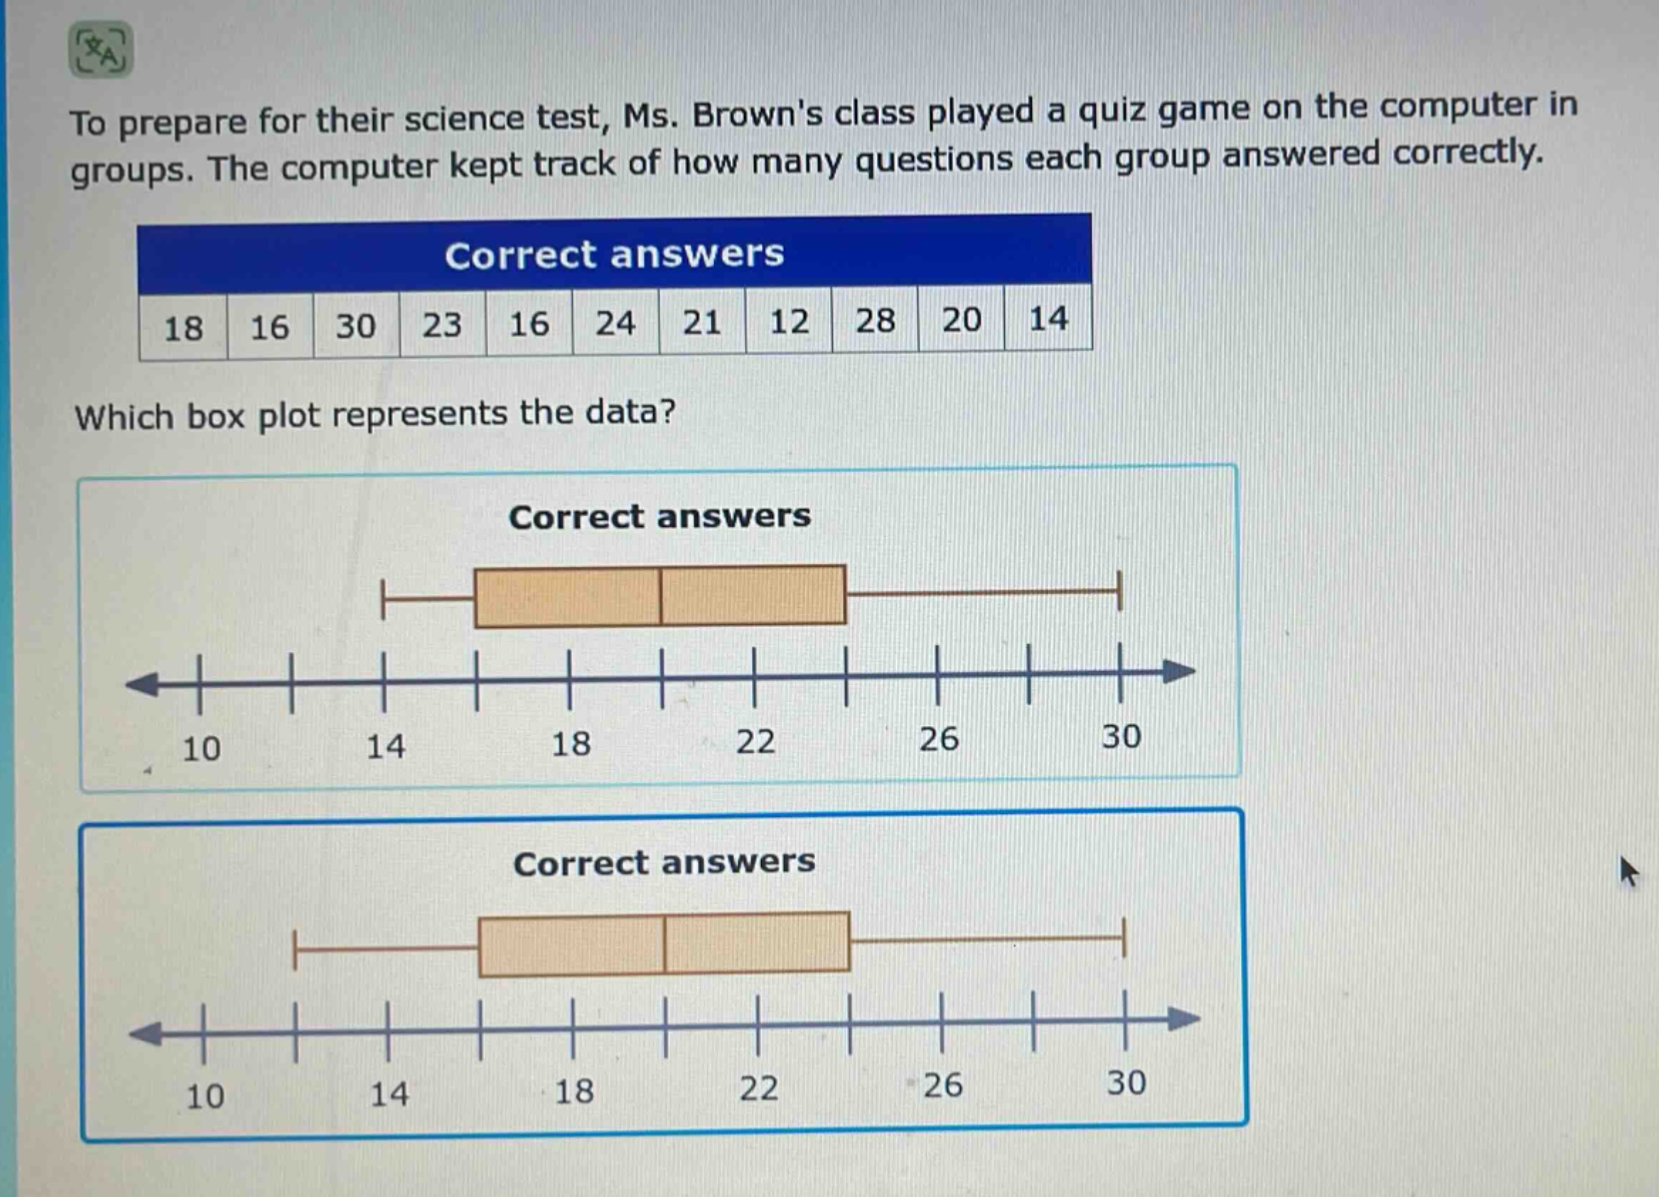
to prepare for their science test, ms. browns class played a quiz game on the computer in groups. the computer kept track of how many questions each group answered correctly. correct answers 18 16 30 23 16 24 21 12 28 20 14 which box plot represents the data? correct answers 10 14 18 22 26 30 correct answers 10 14 18 22 26 30
Answer
Explanation:
Step1: Arrange data in ascending order
$12, 14, 16, 16, 18, 20, 21, 23, 24, 28, 30$
Step2: Find the minimum value
The minimum value is $12$.
Step3: Find the first - quartile ($Q_1$)
There are $n = 11$ data points. The position of $Q_1$ is $\frac{n + 1}{4}=\frac{11+ 1}{4}=3$. So $Q_1 = 16$.
Step4: Find the median ($Q_2$)
The position of the median is $\frac{n + 1}{2}=\frac{11+1}{2}=6$. So $Q_2=20$.
Step5: Find the third - quartile ($Q_3$)
The position of $Q_3$ is $\frac{3(n + 1)}{4}=\frac{3\times(11 + 1)}{4}=9$. So $Q_3=24$.
Step6: Find the maximum value
The maximum value is $30$.
The box - plot should have the left - most whisker at $12$, the left side of the box at $16$, the line inside the box at $20$, the right side of the box at $24$, and the right - most whisker at $30$.
Answer:
The box - plot that has the left - most whisker at $12$, the left side of the box at $16$, the line inside the box at $20$, the right side of the box at $24$, and the right - most whisker at $30$ (without seeing the full options, based on the calculated values this is the correct one). If you provide the full options with clear visual differences, a more definite answer can be given.