the proportion of all high school students who watch national news is $p = 0.57$. a random sample of 60 high…
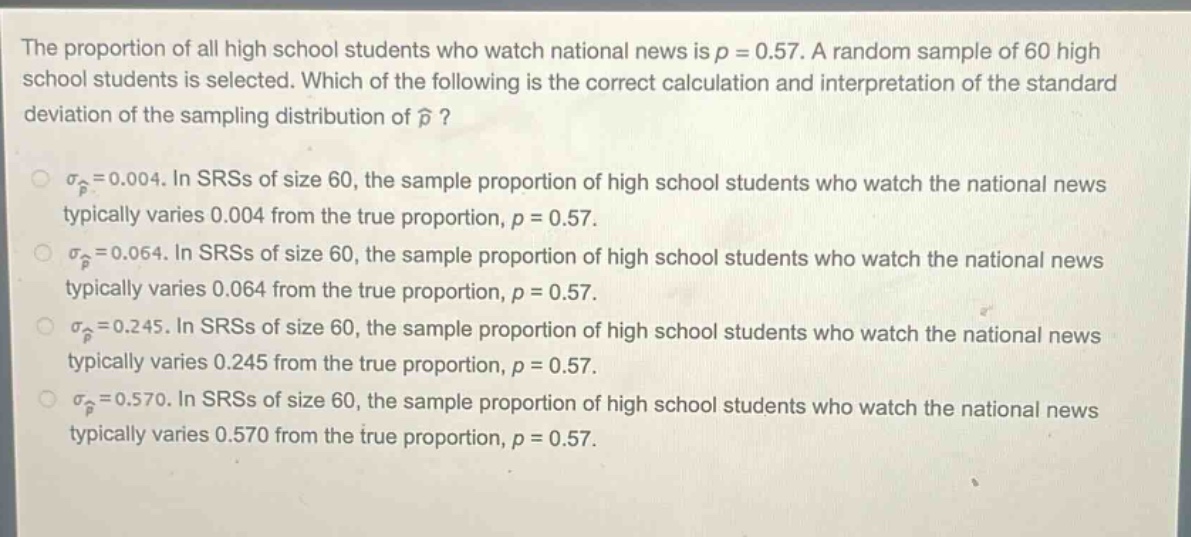
the proportion of all high school students who watch national news is $p = 0.57$. a random sample of 60 high school students is selected. which of the following is the correct calculation and interpretation of the standard deviation of the sampling distribution of $hat{p}$?\n$sigma_{hat{p}}=0.004$. in srss of size 60, the sample proportion of high school students who watch the national news typically varies 0.004 from the true proportion, $p = 0.57$.\n$sigma_{hat{p}}=0.064$. in srss of size 60, the sample proportion of high school students who watch the national news typically varies 0.064 from the true proportion, $p = 0.57$.\n$sigma_{hat{p}}=0.245$. in srss of size 60, the sample proportion of high school students who watch the national news typically varies 0.245 from the true proportion, $p = 0.57$.\n$sigma_{hat{p}}=0.570$. in srss of size 60, the sample proportion of high school students who watch the national news typically varies 0.570 from the true proportion, $p = 0.57$.
Answer
Answer:
B. $\sigma_{\hat{p}} = 0.064$. In SRSs of size 60, the sample proportion of high - school students who watch the national news typically varies 0.064 from the true proportion, $p = 0.57$.
Explanation:
Step1: Recall the formula for standard deviation of sampling distribution of proportion
$\sigma_{\hat{p}}=\sqrt{\frac{p(1 - p)}{n}}$
Step2: Identify values of $p$ and $n$
$p = 0.57$, $n=60$
Step3: Substitute values into the formula
$\sigma_{\hat{p}}=\sqrt{\frac{0.57\times(1 - 0.57)}{60}}=\sqrt{\frac{0.57\times0.43}{60}}=\sqrt{\frac{0.2451}{60}}\approx\sqrt{0.004085}\approx0.064$ This value represents how much the sample proportion typically varies from the true proportion in simple random samples (SRSs) of size 60.